Dive into the current set of Core Web Vitals, plus tips and tools to boost your web performance and deliver a good page experience for users.
Collecting data on your site’s performance is the first step toward delivering a great user experience. Over the years, Google has provided various tools to assess and report on web performance.
Among them are Core Web Vitals, a set of performance signals that Google deems critical to all web experiences.
This article covers the current set of Core Web Vitals and key tips and tools to improve your web performance to deliver a good page experience for users.
A look at the evolution of web performance
Gone are the days when improving site performance was straightforward.
In the past, bloated resources and laggy connections often held up websites. But you could outperform competitors by compressing some images, enabling text compression or minifying your style sheets and JavaScript modules.
Today, connection speeds are faster. Most resources are compressed by default and many plugins handle image compression, cache deployment, etc.
Google’s quest for a faster web persists. PageSpeed Insights (PSI) is still live on web.dev, serving as the best tool to evaluate individual page loads.
While many feel that PSI ratings are unnecessarily punitive, it’s still the closest we can get to how Google might weigh and rank sites via page speed signals.
To pass the latest iteration of Google’s page speed test, you’ll need to satisfy the Core Web Vitals Assessment.
Understanding the Core Web Vitals
Core Web Vitals are a set of metrics integrated into the broader page experience search signals introduced in 2021. Each metric “represents a distinct facet of the user experience, is measurable in the field, and reflects the real-world experience of a critical user-centric outcome,” according to Google.
The current set of Core Web Vitals metrics include:
- First Contentful Paint
- First Input Delay
- First Input Delay (to be replaced by Interaction to Next Paint)
- Interaction to Next Paint
- Time to First Byte
- Largest Contentful Paint
- Cumulative Layout Shift
Web.dev explains how each metric works as follows.
First Contentful Paint (FCP)
“The First Contentful Paint (FCP) metric measures the time from when the page starts loading to when any part of the page’s content is rendered on the screen. For this metric, “content” refers to text, images (including background images),
<svg>elements, or non-white<canvas>elements.”
What this means for technical SEOs
FCP is fairly easy to understand. As a webpage loads, certain elements arrive (or “are painted”) before others. In this context, “painting” means on-screen rendering.
Once any part of the page has been rendered – let’s say the main nav bar loads in before other elements – the FCP will be logged at that point.
Think of it as how quickly the page begins visibly loading for users. The page load won’t be complete, but it will have started.
First Input Delay (FID)
“FID measures the time from when a user first interacts with a page (that is, when they click a link, tap on a button, or use a custom, JavaScript-powered control) to the time when the browser is actually able to begin processing event handlers in response to that interaction.”
What this means for technical SEOs
FID is a user interaction responsiveness metric set to be replaced by Interaction to Next Paint (INP) in March 2024.
If a user interacts with an on-page element (i.e., a link, sorting a table, or applying faceted navigation), how long will it take for the site to begin processing that request?
Interaction to Next Paint (INP)
“INP is a metric that assesses a page’s overall responsiveness to user interactions by observing the latency of all click, tap, and keyboard interactions that occur throughout the lifespan of a user’s visit to a page. The final INP value is the longest interaction observed, ignoring outliers.”
What this means for technical SEOs
As mentioned, INP will replace FID as a Core Web Vital in March 2024.
INP factors deeper information (apparently stretching back to the keyboard) and is likely more detailed and sophisticated.
Time to First Byte (TTFB)
“TTFB is a metric that measures the time between the request for a resource and when the first byte of a response begins to arrive.”
What this means for technical SEOs
Once a “resource” (i.e., embedded image, JavaScript module, CSS stylesheet, etc.) is requested, how long will it take for the site to begin delivering that resource?
Let’s say you visit a webpage, and on that page is an embedded image. It begins to load but hasn’t finished loading yet. How long until the very first byte of that image is delivered from server to client (web browser)?
Largest Contentful Paint (LCP)
“The Largest Contentful Paint (LCP) metric reports the render time of the largest image or text block visible within the viewport, relative to when the page first started loading.”
What this means for technical SEOs
LCP is one of the most important metrics yet the trickiest to satisfy.
Once the largest chunk of visual media (i.e., text or image) has loaded, the LCP is logged.
You can read this as, how long does it take for the vast bulk of a page’s main content to load?
Maybe there are still little bits loading further down the page, and things that most users won’t notice.
But, by the time the LCP is logged, the large and obvious chunk of your page has loaded. If it takes too long for this to occur, you will fail the LCP check.
Cumulative Layout Shift (CLS)
“CLS is a measure of the largest burst of layout shift scores for every unexpected layout shift that occurs during the entire lifespan of a page.
A layout shift occurs any time a visible element changes its position from one rendered frame to the next. (See below for details on how individual layout shift scores are calculated.)
A burst of layout shifts, known as a session window, is when one or more individual layout shifts occur in rapid succession with less than 1-second in between each shift and a maximum of 5 seconds for the total window duration.
The largest burst is the session window with the maximum cumulative score of all layout shifts within that window.”
What this means for technical SEOs
Back in the day, when page speed optimization was simpler, many site owners realized they could achieve incredibly high page speed ratings by simply deferring all of the render-blocking resources (commonly, CSS sheets and JavaScript modules).
This was great at speeding up page loads but made the web a more glitchy and annoying navigation experience.
If your CSS – which controls all the styling of your page – is deferred, then the contents of the page can load before the CSS rules are applied.
This means that the contents of your page will load unstyled, and then jump about a bit as the CSS loads in.
This is really annoying if you load a page and click on a link, but then the link jumps and you click on the wrong link.
If you’re a bit OCD like me, such experiences are absolutely infuriating (even though they only cost seconds of time).
Due to site owners attempting to “game” page speed ratings by deferring all resources, Google needed a counter-metric, which would offset all the page speed gains against the user experience deficit.
Enter Cumulative Layout Shift (CLS). This is one tricky customer, who is out to ruin your day if you try to broad-brush apply page speed boosts without thinking of your users.
CLS will basically analyze your page loads for glitchy shifts and delayed CSS rules.
If there are too many, you will fail the Core Web Vitals assessment despite having satisfied all speed-related metrics.
Assessing your Core Web Vitals for better UX and SEO results
One of the best ways to analyze a single webpage’s performance is to load it into PageSpeed Insights. The view is split into a combination of:
- URL-level data.
- Origin (domain-level) data.
- Lab data.
- Field data.
To make sense of this, we need to look at an example:
https://pagespeed.web.dev/analysis/https-techcrunch-com/zo8d0t4x1p?form_factor=mobile
Here, we can see the page speed ratings and metrics for the TechCrunch homepage.
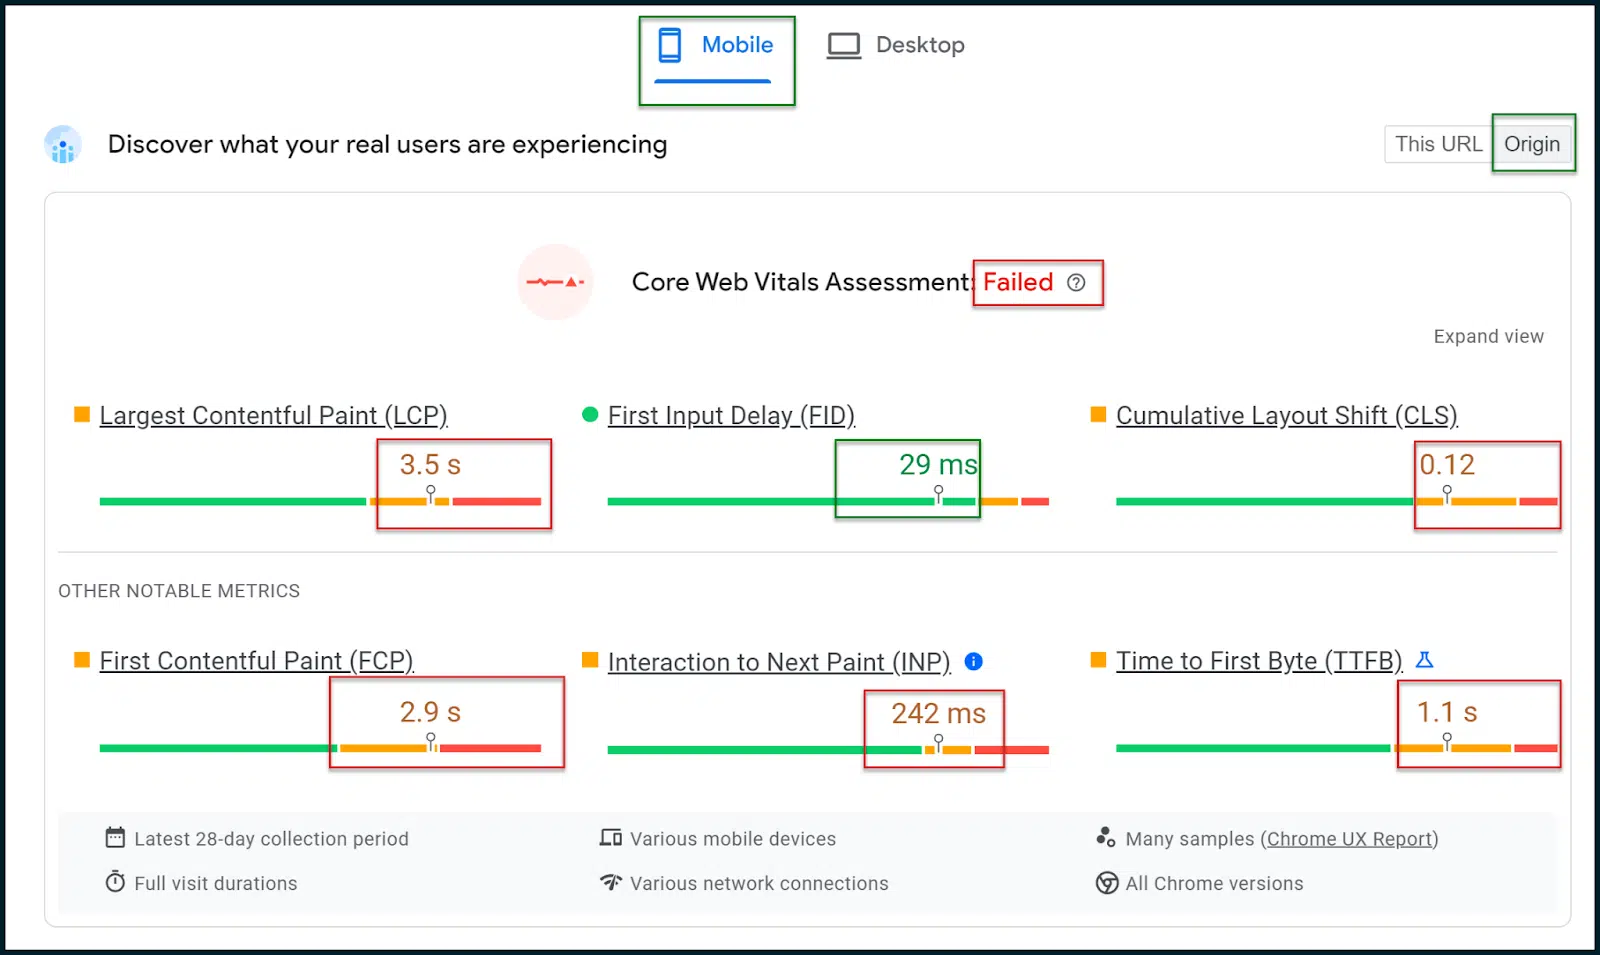
Above, you can see that the Core Web Vitals Assessment has failed.
In a mobile-first web, it’s important to select the Mobile results tab, which should be rendered by default (these are the results that really matter).
Select the Origin toggle so you see general data averaged across your site’s domain rather than just the homepage (or whichever page you put in to scan).
Further down the page, you will see the old, familiar numeric page speed rating:
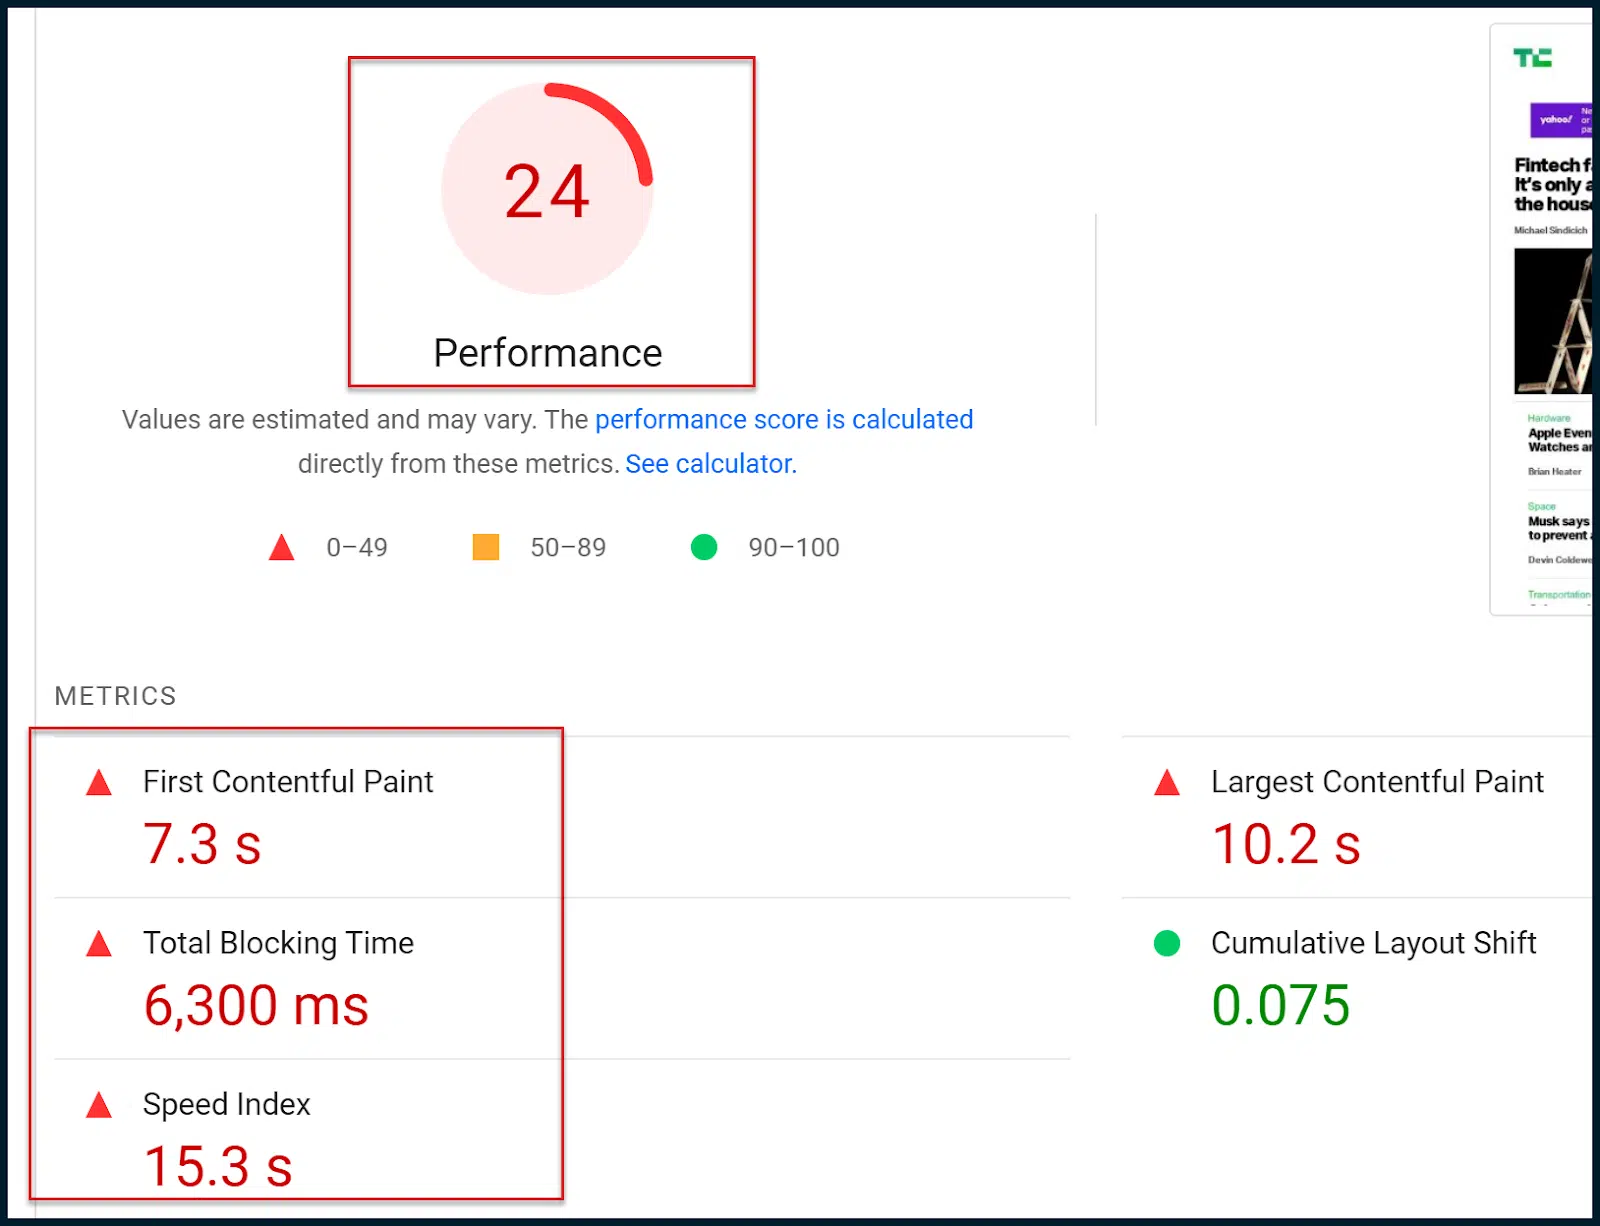
So, what’s the difference between the new Core Web Vitals assessment and the old page speed rating?
Essentially, the new Core Web Vitals assessment (Pass / Fail) is based on field (real user) data.
The old numeric rating is based on simulated mobile crawls and lab data, which are only estimates.
Essentially, Google has shifted to the Core Web Vitals assessment in terms of modifying search rankings.
To be clear, the simulated lab data can give a nice breakdown in terms of what’s going wrong, but Google does not utilize that numeric rating within their ranking algorithms.
Conversely, the Core Web Vitals assessment doesn’t offer much granular information. However, this assessment is factored into Google’s ranking algorithms.
So, your main aim is to use the richer lab diagnostics so that you eventually pass the Core Web Vitals assessment (derived via field data).
Remember that when you make changes to your site, while the numeric rating may immediately observe changes, you’ll have to wait for Google to pull more field data before you can eventually pass the Core Web Vitals assessment.
You will note that both the Core Web Vitals assessment and the old page speed rating utilize some of the same metrics.
For example, both of them reference First Contentful Paint (FCP), Largest Contentful Paint (LCP) and Cumulative Layout Shift (CLS).
In a way, the types of metrics examined by each rating system are fairly similar. It’s the level of detail and the source of the examined data, which is different.
You must aim to pass the field-based Core Web Vitals assessment. However, since the data is not too rich, you may wish to leverage the traditional lab data and diagnostics to progress.
The hope is that you can pass the Core Web Vitals assessment by addressing the lab opportunities and diagnostics. But do remember, these two tests are not intrinsically connected.
function getCookie(cname) {
let name = cname + “=”;
let decodedCookie = decodeURIComponent(document.cookie);
let ca = decodedCookie.split(‘;’);
for(let i = 0; i <ca.length; i++) {
let c = ca[i];
while (c.charAt(0) == ' ') {
c = c.substring(1);
}
if (c.indexOf(name) == 0) {
return c.substring(name.length, c.length);
}
}
return "";
}
document.getElementById('munchkinCookieInline').value = getCookie('_mkto_trk');
Assessing your CWVs via PageSpeed Insights
Now that you know the main Core Web Vitals metrics and how they can technically be satisfied, it’s time to run through an example.
Let’s go back to our examination of TechCrunch:
https://pagespeed.web.dev/analysis/https-techcrunch-com/zo8d0t4x1p?form_factor=mobile
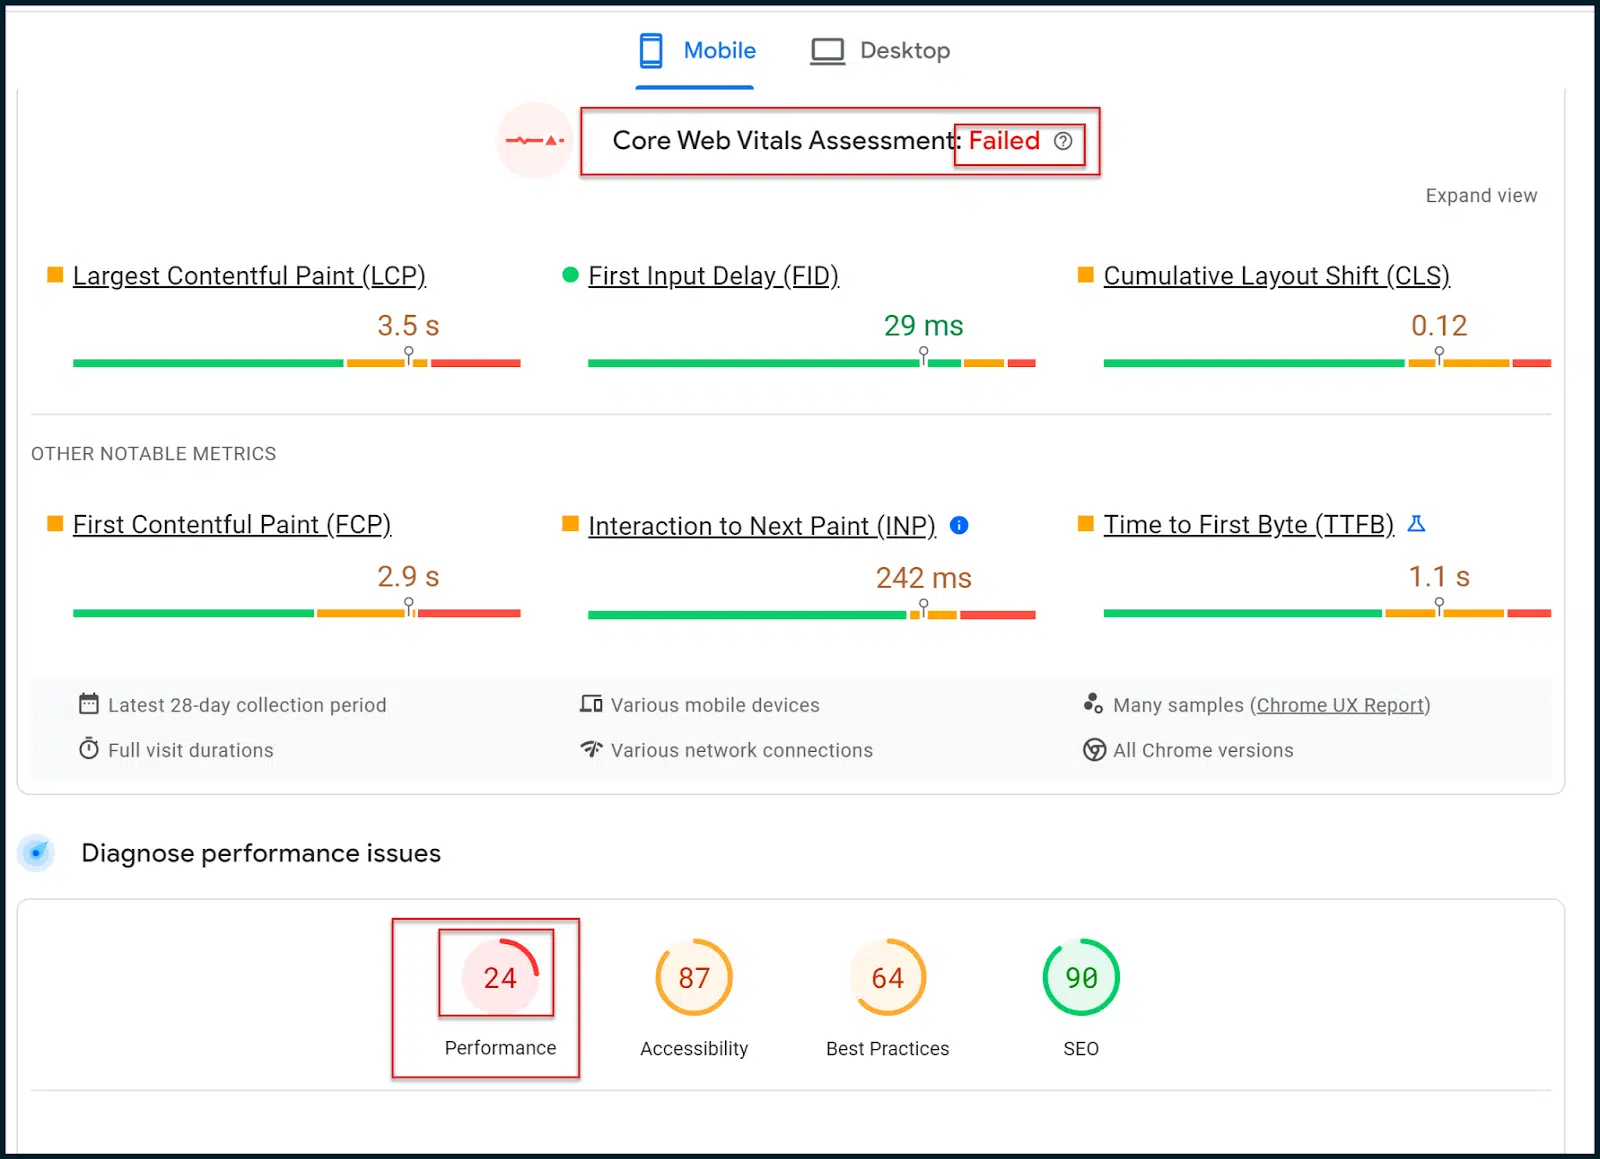
Here, FID is satisfied, and INP only fails by a narrow margin.
CLS has some issues, but the main problems are with LCP and FCP.
Let’s see what PageSpeed Insights has to say in terms of Opportunities and Diagnostics.
We must now shift over from the field data to the lab data and attempt to isolate any patterns that may be impacting the Core Web Vitals:

Above, you can see a small sub-navigation in the upper right corner boxed in green.
You can use this to narrow the different opportunities and diagnostics to certain Core Web Vitals metrics.
In this case, however, the data tells a very clear story without narrowing.
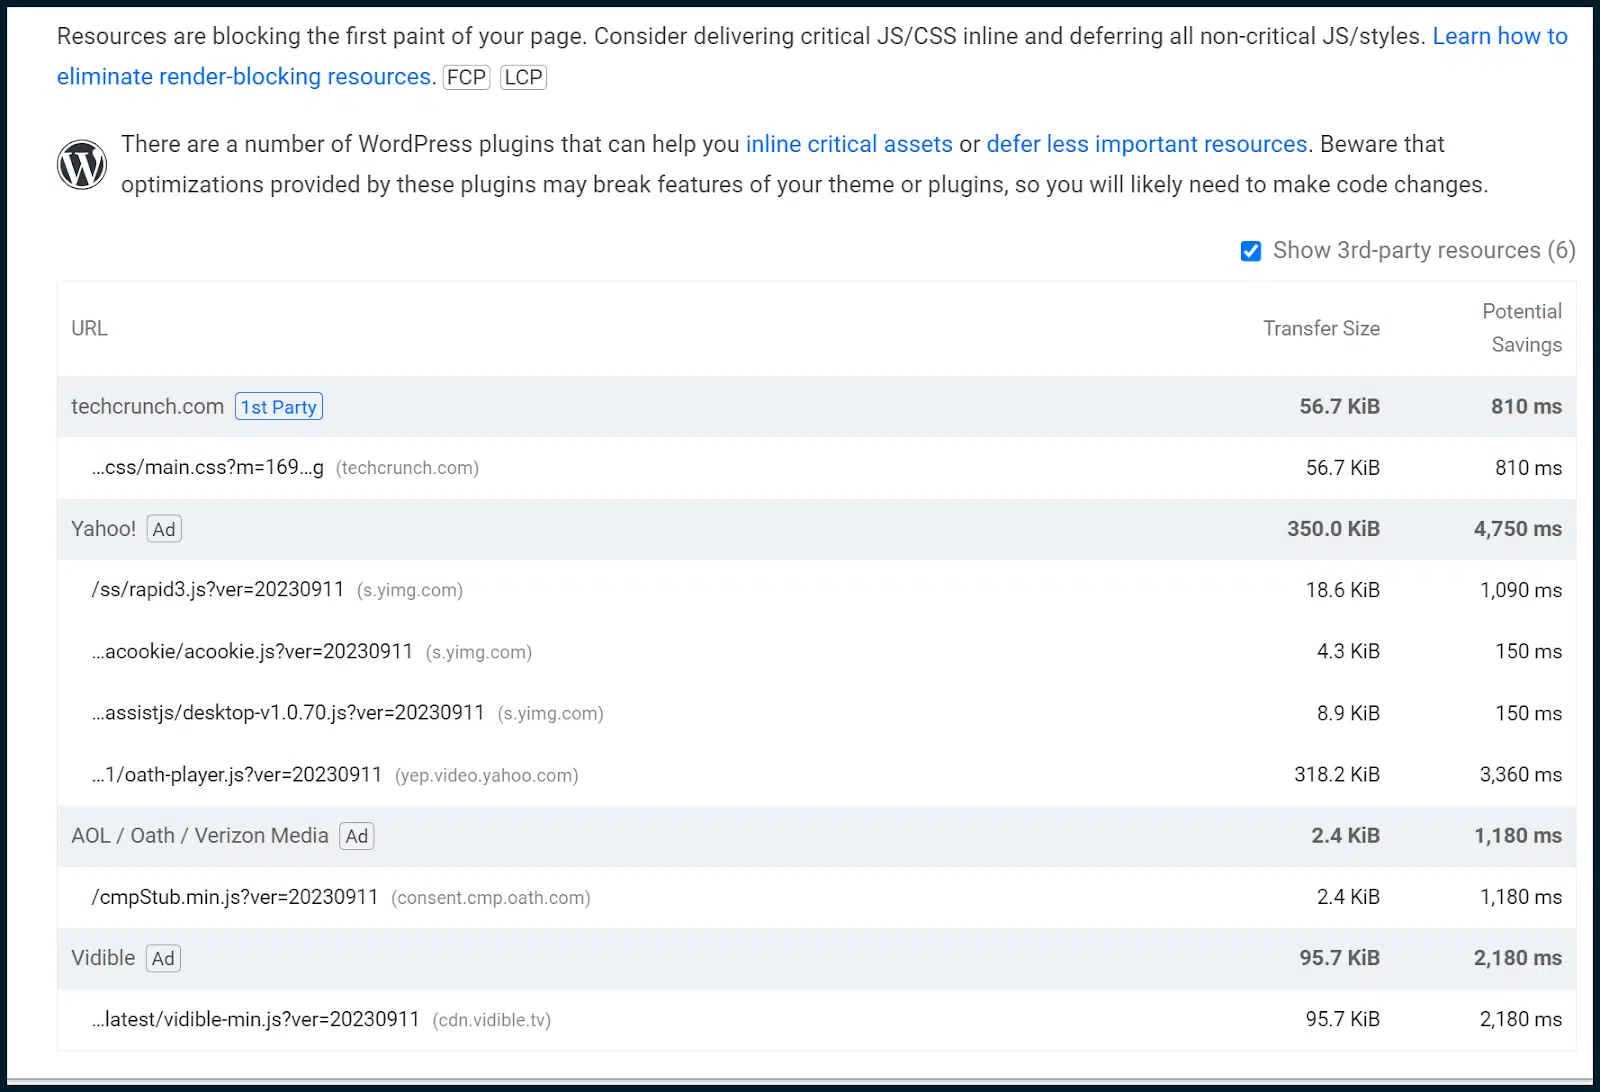
Firstly, we are told to reduce unused JavaScript. This means that sometimes, JavaScript is being loaded without being executed.
There are also notes to reduce unused CSS. In other words, some CSS styling is loading, which isn’t being applied (similar problem).
We’re also told to eliminate render-blocking resources, which are almost always related to JavaScript modules and CSS sheets.
Render-blocking resources must be deferred to stop them from blocking a page load. However, as we have already explored, this may disrupt the CLS rating.
Due to this, it would be wise to begin crafting both a critical CSS and a critical JavaScript rendering path. Doing this will inline JavaScript and CSS needed above the fold while deferring the rest.
This approach enables the site owner to satisfy page loading demands while balancing with the CLS metric. It’s not an easy thing to do and usually requires a senior web developer.
Since we also found unused CSS and JavaScript, we can also issue a general JavaScript code audit to see if JavaScript could be deployed more intelligently.
Let’s go back to Opportunities and Diagnostics:
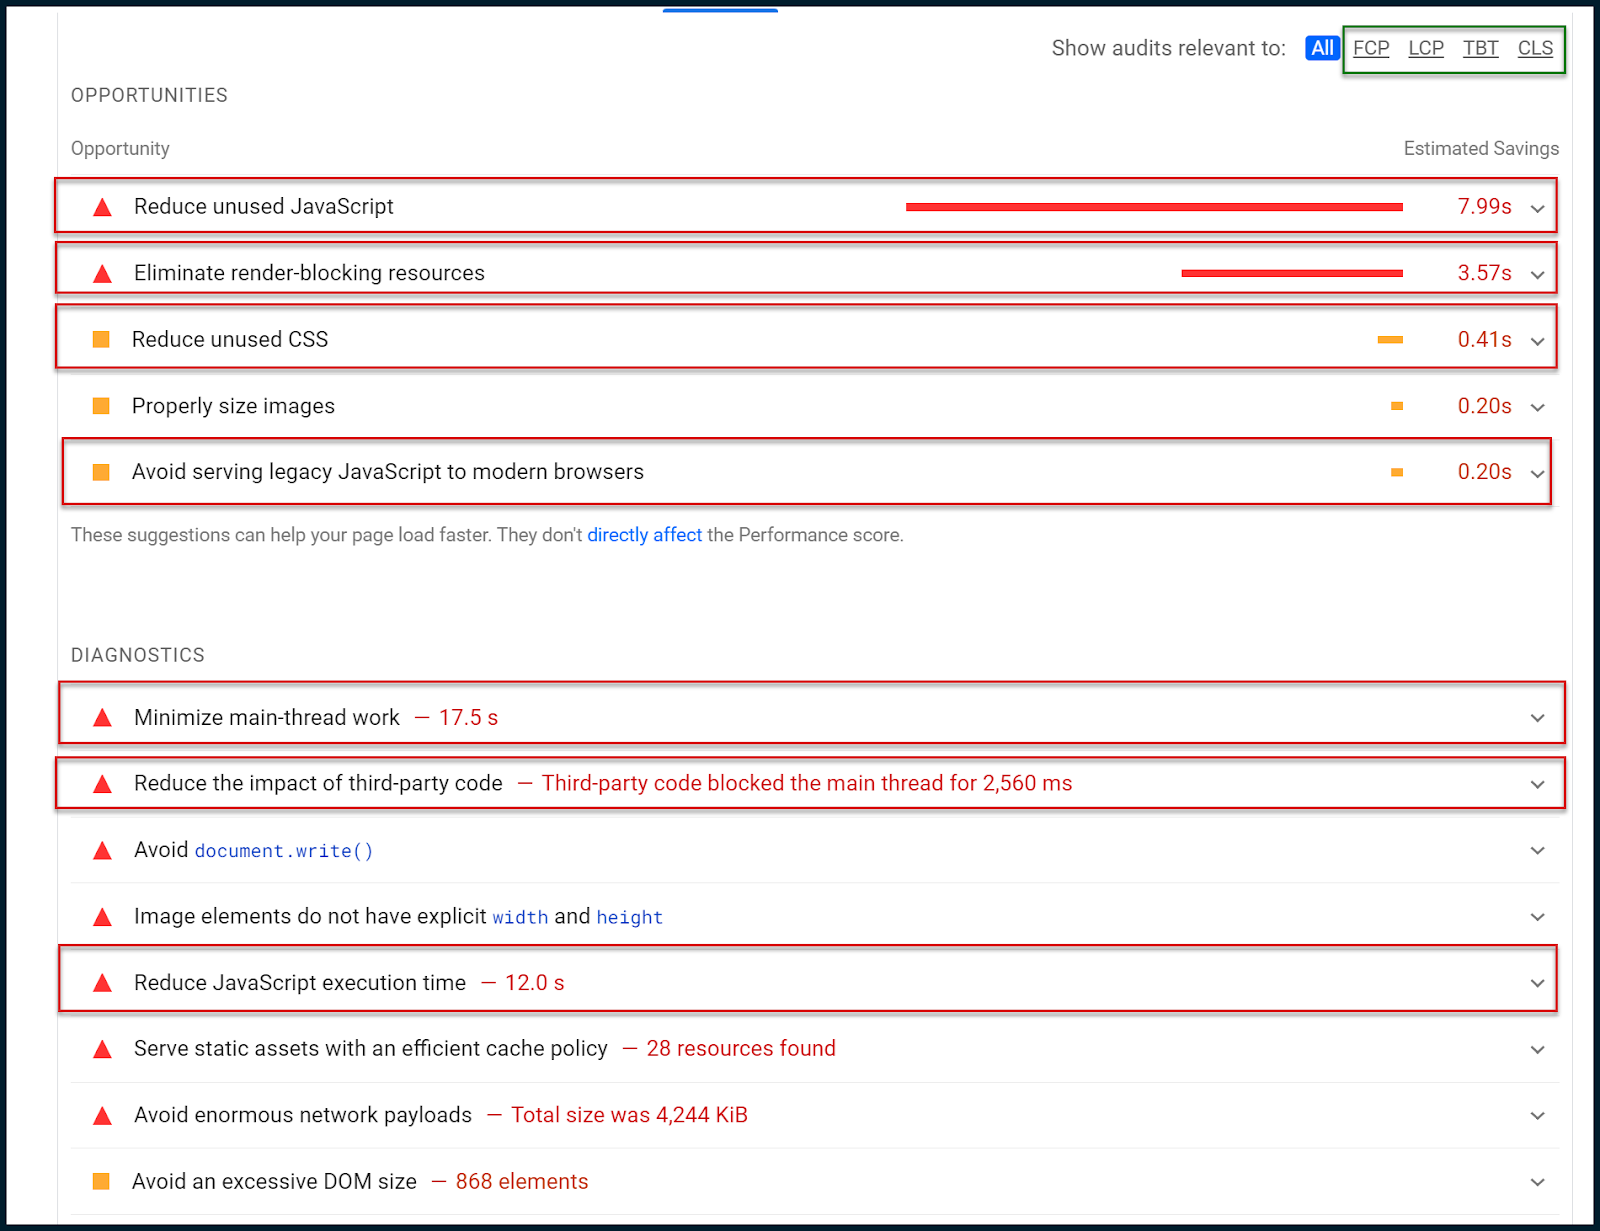
Now, we want to focus on the diagnostics. Google deliberately throttles these checks through poor 4G connections, so items such as the main-thread work seem so long (17 seconds).
This is deliberate in order to satisfy users with low bandwidth and/or slow devices which are common worldwide.
I want to draw your attention here to “Minimize main-thread work.” This single entry is often a goldmine of insights.
By default, most of a webpage’s rendering and script execution (JavaScript) tasks are pushed through a client’s web browser’s main processing thread (one single processing thread). You can understand how this causes significant page loading bottlenecks.
Even if all of your JavaScript is perfectly minified and shipped to the user’s browser quickly, it must wait in a single thread processing queue by default, meaning that only one script can be executed at once.
So, quickly shipping loads of JavaScript to your user is the equivalent of firing a firehose at a brick wall with a one-centimeter gap.
Good job delivering, but it’s not all going to go through!
More and more, Google is pushing client-side speed responsiveness as our responsibility. Like it or lump it, that’s how it is (so you’d better get familiar).
You might say in frustration, “Why is it like this!? Web browsers have had access to multiple processing threads for years, even mobile browsers have caught up. There’s no need for things to be this awkward, is there?”
Actually, yes. Some scripts rely on the output of other scripts before they themselves can execute.
In all likelihood, if all browsers were suddenly to start processing all JavaScript in parallel, out of sequence, most of the web would probably crash and burn.
So, there’s a good reason that sequential script execution is the default behavior for modern web browsers. I keep emphasizing the word “default.” Why is that?
It’s because there are other options. One is to prevent the client’s browser from processing any scripts by processing them on the user’s behalf. This is known as server-side rendering (SSR).
It’s a powerful tool to detangle client-side JavaScript execution knots but also very expensive.
Your server must process all script requests (from all users) faster than your average user’s browser processes a single script. Let that one sink in for a moment.
Not a fan of that option? OK, let’s explore JavaScript parallelization. The basic idea is to leverage web workers to define which scripts will load in sequence vs. which may load in parallel.
While you can force JavaScript to load in parallel, doing this by default is extremely inadvisable. Integrating technology such as this would largely mitigate the need for SSR in most cases.
However, it will be very fiddly to implement and will require (you guessed it!) the time of a senior web developer.
The same guy you hire to do your full JavaScript code audit might be able to help you with this, too. If you combine JavaScript parallelization with a critical JavaScript rendering path, then you’re really flying.
In this example, here’s the really interesting thing:
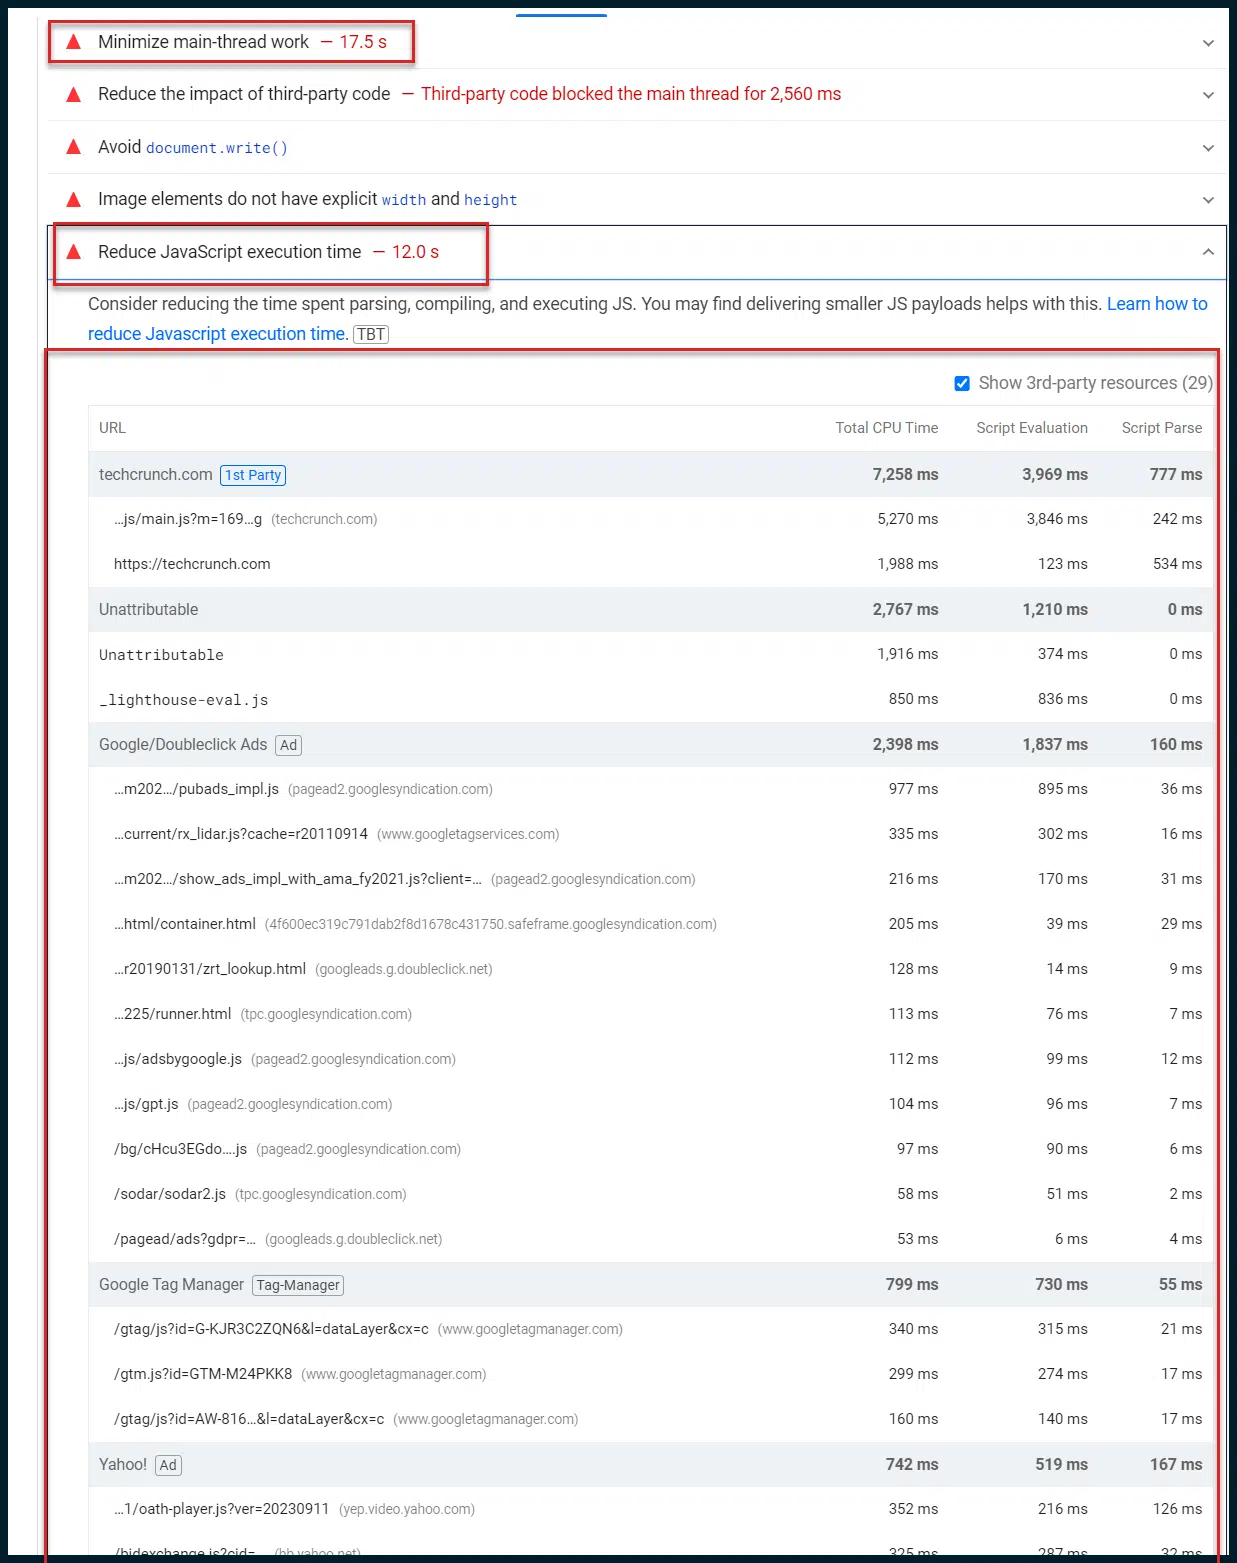
You can immediately see that whilst the main thread is occupied for 17 seconds, JavaScript execution accounts for 12 seconds.
Does that mean 12 seconds of the 17 seconds of thread work are JavaScript execution? That is highly likely.
We know that all JavaScript is pushed through the main thread by default.
That’s also how WordPress, the active CMS, is set up by default.
Since this site is running WordPress, all of those 12 seconds of JavaScript execution time likely come out of the 17 seconds of main thread work.
That’s a great insight because it tells us that most of the main processing thread’s time is spent executing JavaScript. And looking at the number of referenced scripts, that’s not hard to believe.
Taking the crusade to Chrome Dev Tools
It’s time to get technical and remove the training wheels.
Open a new instance of Chrome. You should open a guest profile to ensure there’s no clutter or enabled plugins to bloat our findings.
Remember: perform these actions from a clean guest Chrome profile.

Load up the site you want to analyze. In our case, that’s TechCrunch.
Accept cookies as needed. Once the page is loaded, open Chrome DevTools (right-click a page and select Inspect).

Navigate to Performance > Screenshots.
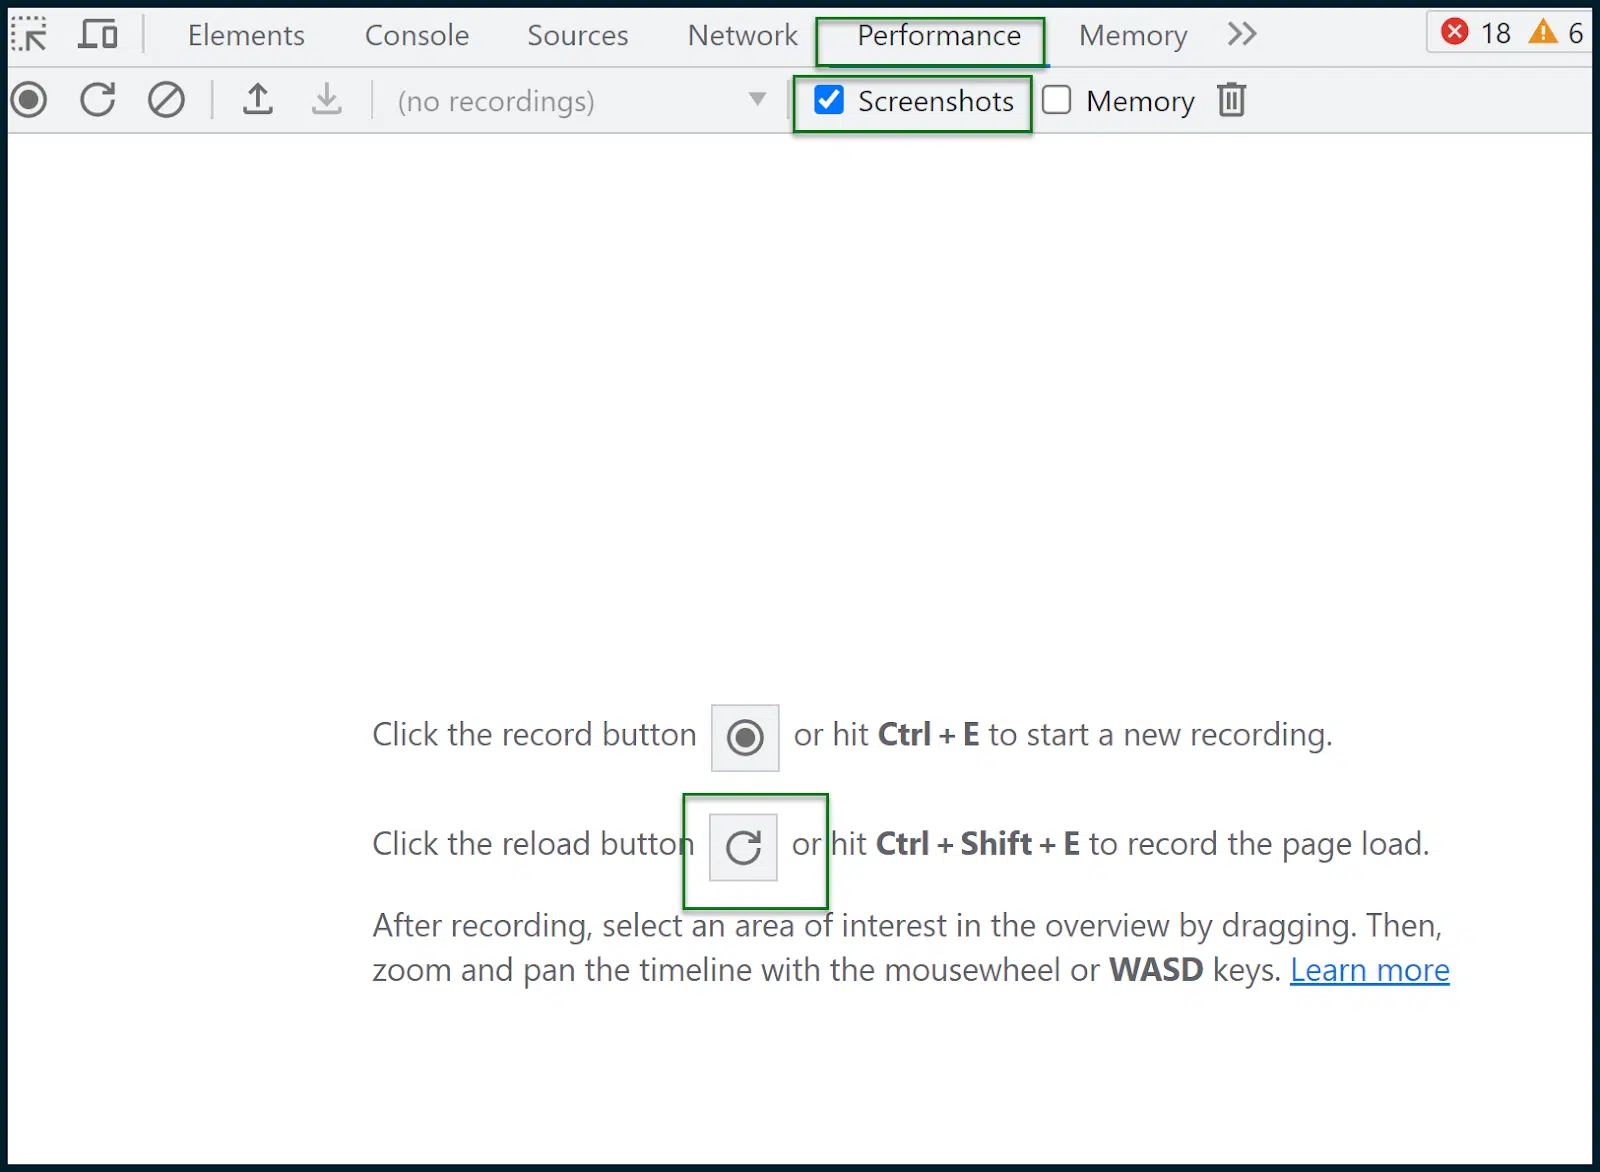
Hit the reload button to record the page load. A report will then be generated:
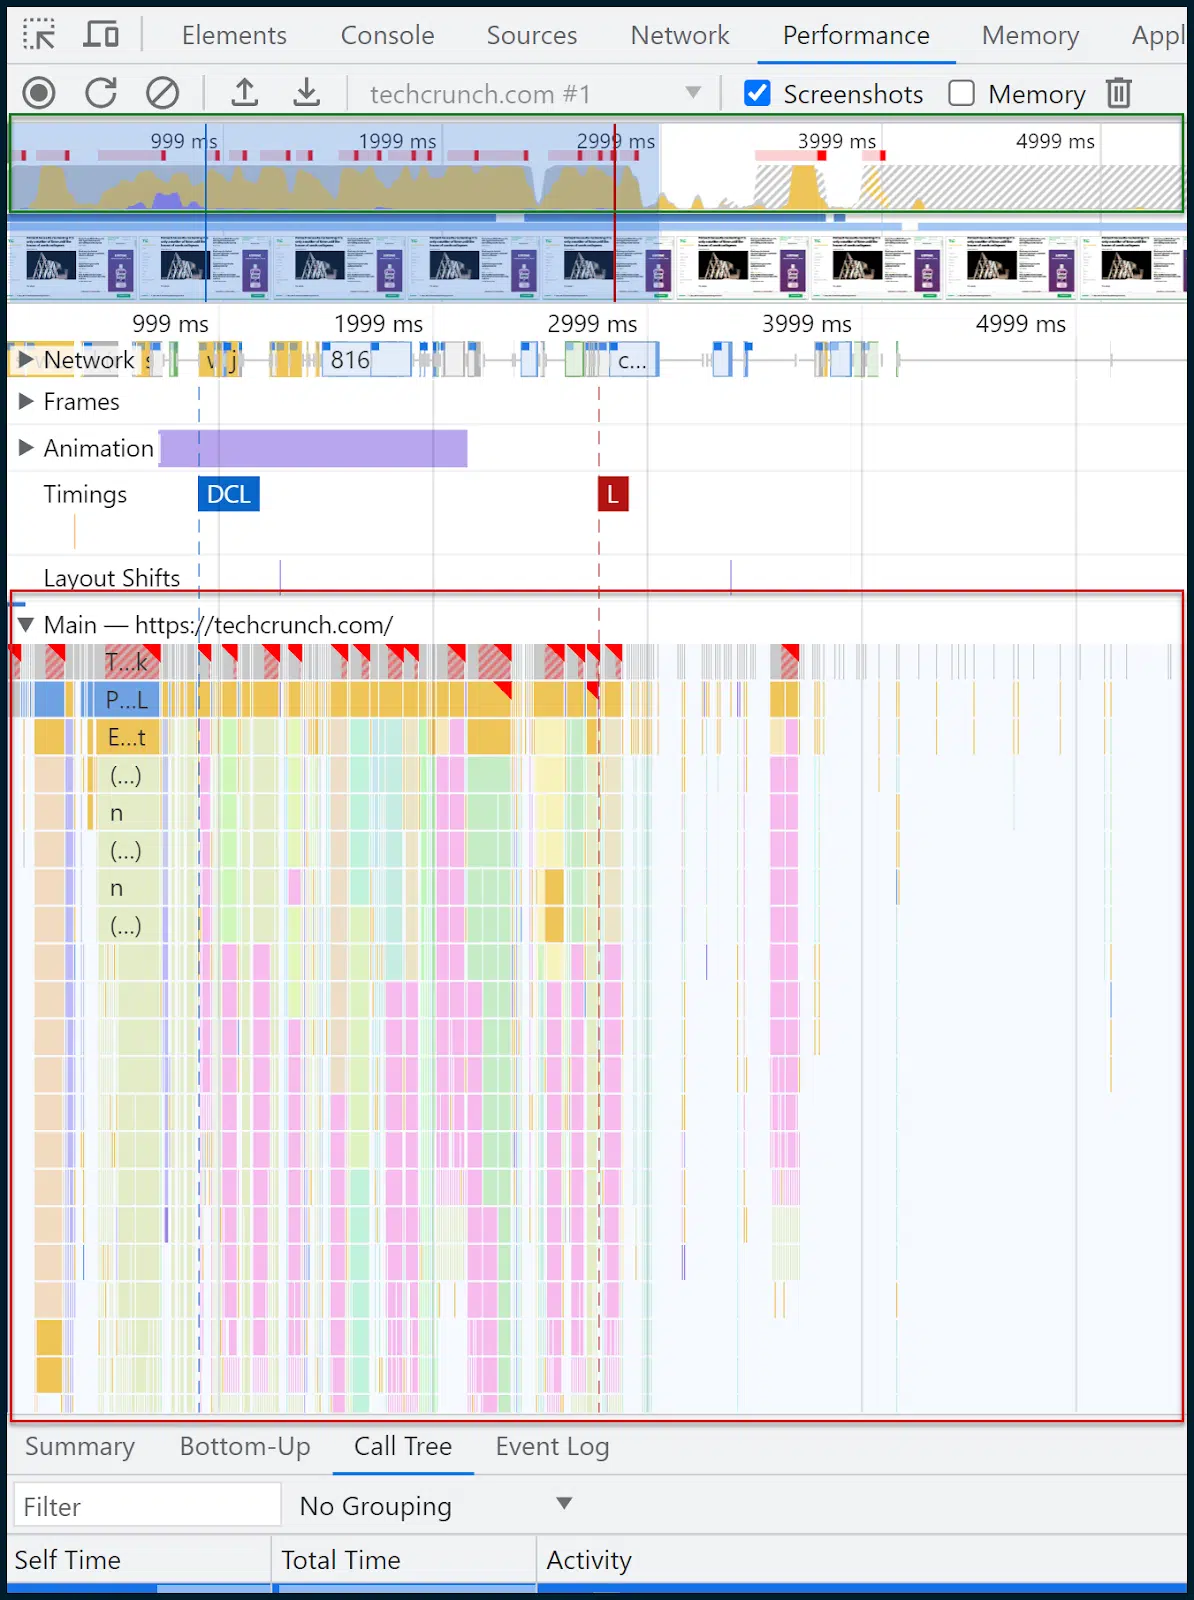
This is where we all need to take a deep breath and try not to panic.
Above, boxed in green, you can see a thin pane that illustrates requests over time.
Within this box, you can drag your mouse to select a time slice, and the rest of the page and analysis will automatically adapt.
The region I have selected manually is the area covered with a semi-transparent blue box.
That’s where the main page load happens and what I’m interested in examining.
In this case, I have roughly selected the range of time and events between 32ms and 2.97 seconds. Let’s focus our gaze on the interior of the main thread:
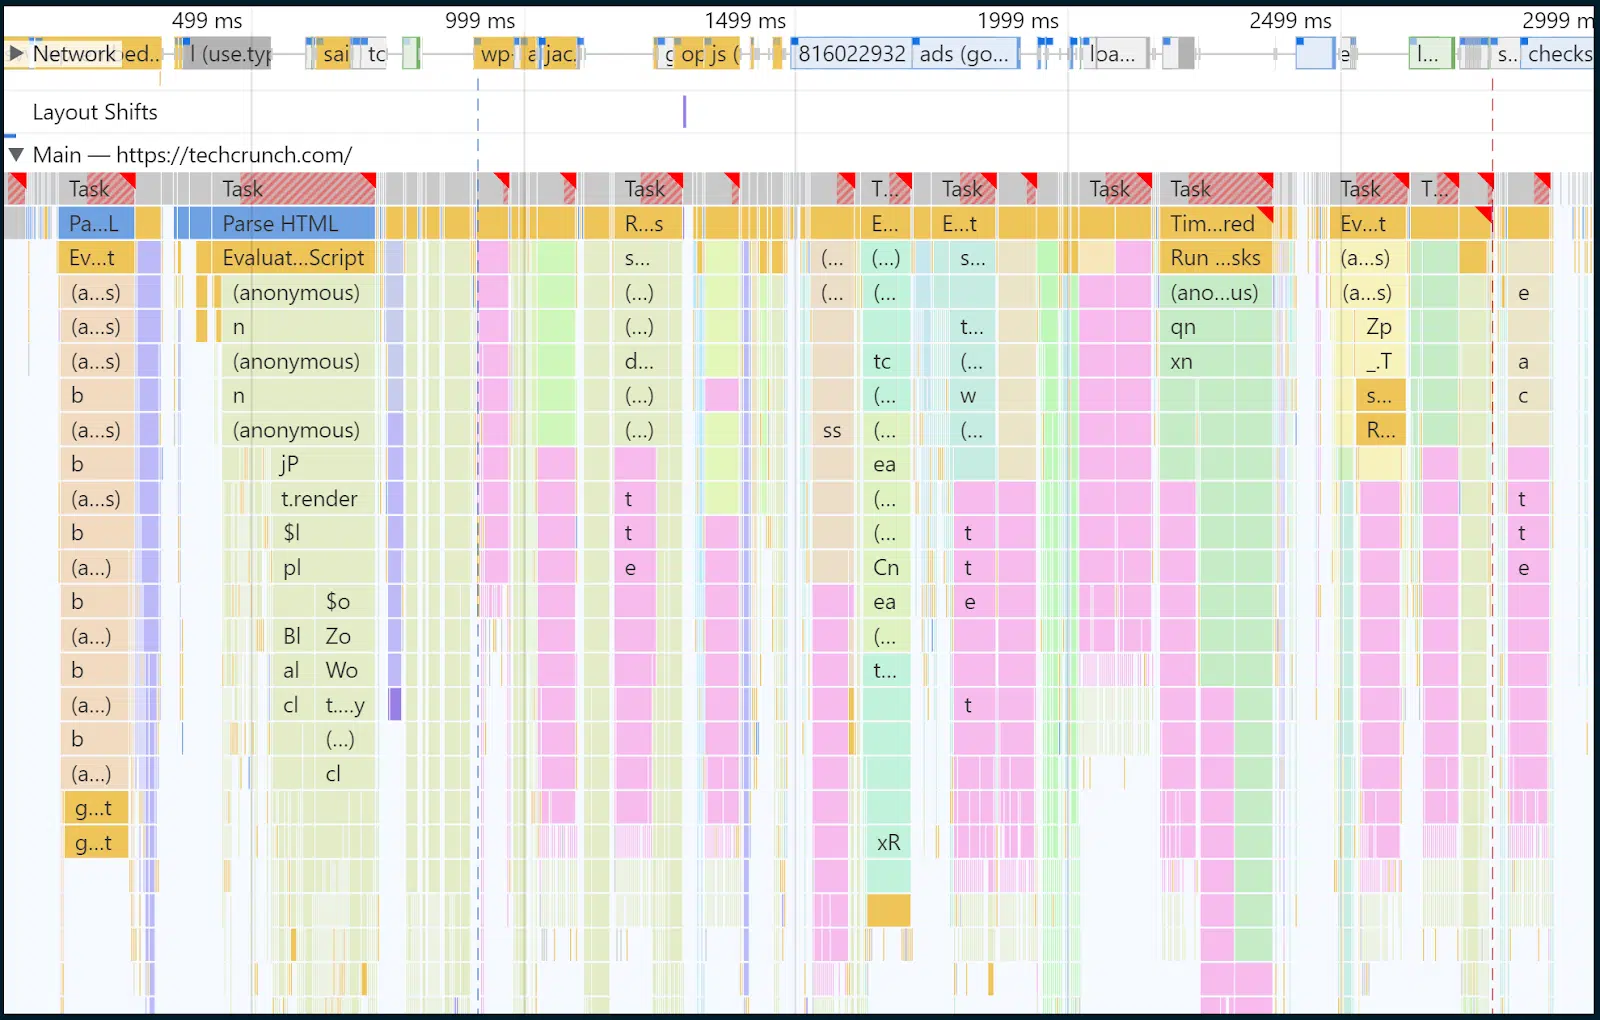
You know how earlier, I was saying that most rendering tasks and JavaScript executions are forced through the bottleneck of the main thread?
Well, we’re now looking at the interior of that main thread over time. And yes, in yellow, you can see a lot of scripting tasks.
On the top couple of rows, as time progresses, there are more and more dark yellow chunks confirming all the executing scripts and how long they take to process. You can click on individual bar chunks to get a readout for each item.
Although this is a powerful visual, you’ll find a more powerful one in the Summary section:
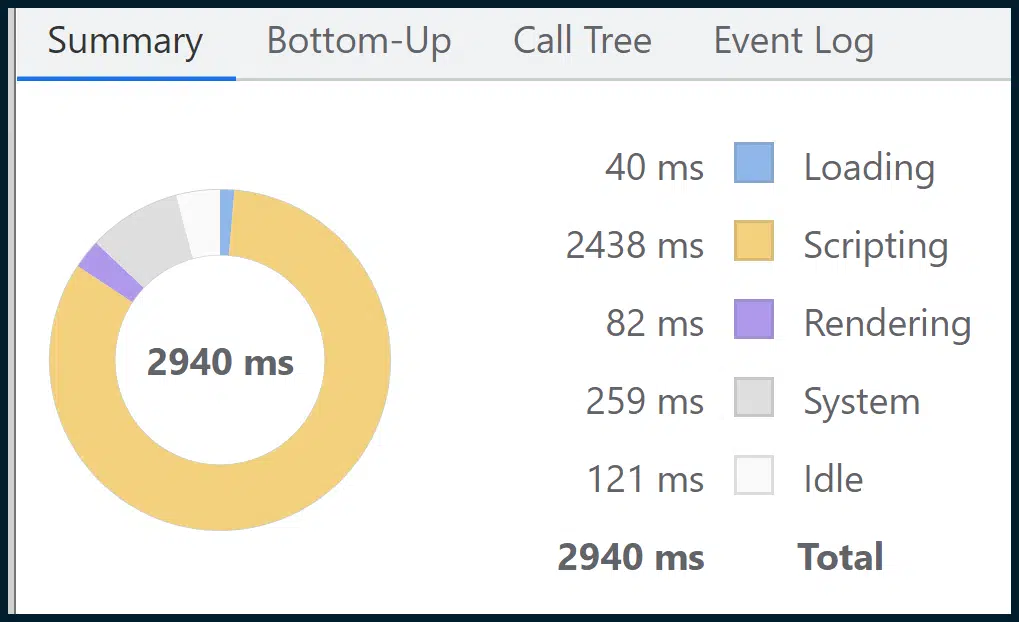
This sums up all the granular data, broken down into simple thematic sections (e.g., Scripting, Loading, Rendering) via the easy-to-digest visual medium of a doughnut chart.
As you can see, scripting (script execution) takes up most of the page load. So, our earlier supposition from Google’s mix of field and lab data, which pointed the finger at JavaScript execution bottlenecks in the main thread, seems to have been accurate.
In 2023, this is one of the most widely encountered issues, with few simple, off-the-shelf solutions.
It’s complex to create critical JavaScript rendering paths. It takes expertise to perform JavaScript code audits, and it is not so simple to adopt JavaScript parallelization or SSR.
Now let’s go and look at the Call Tree:
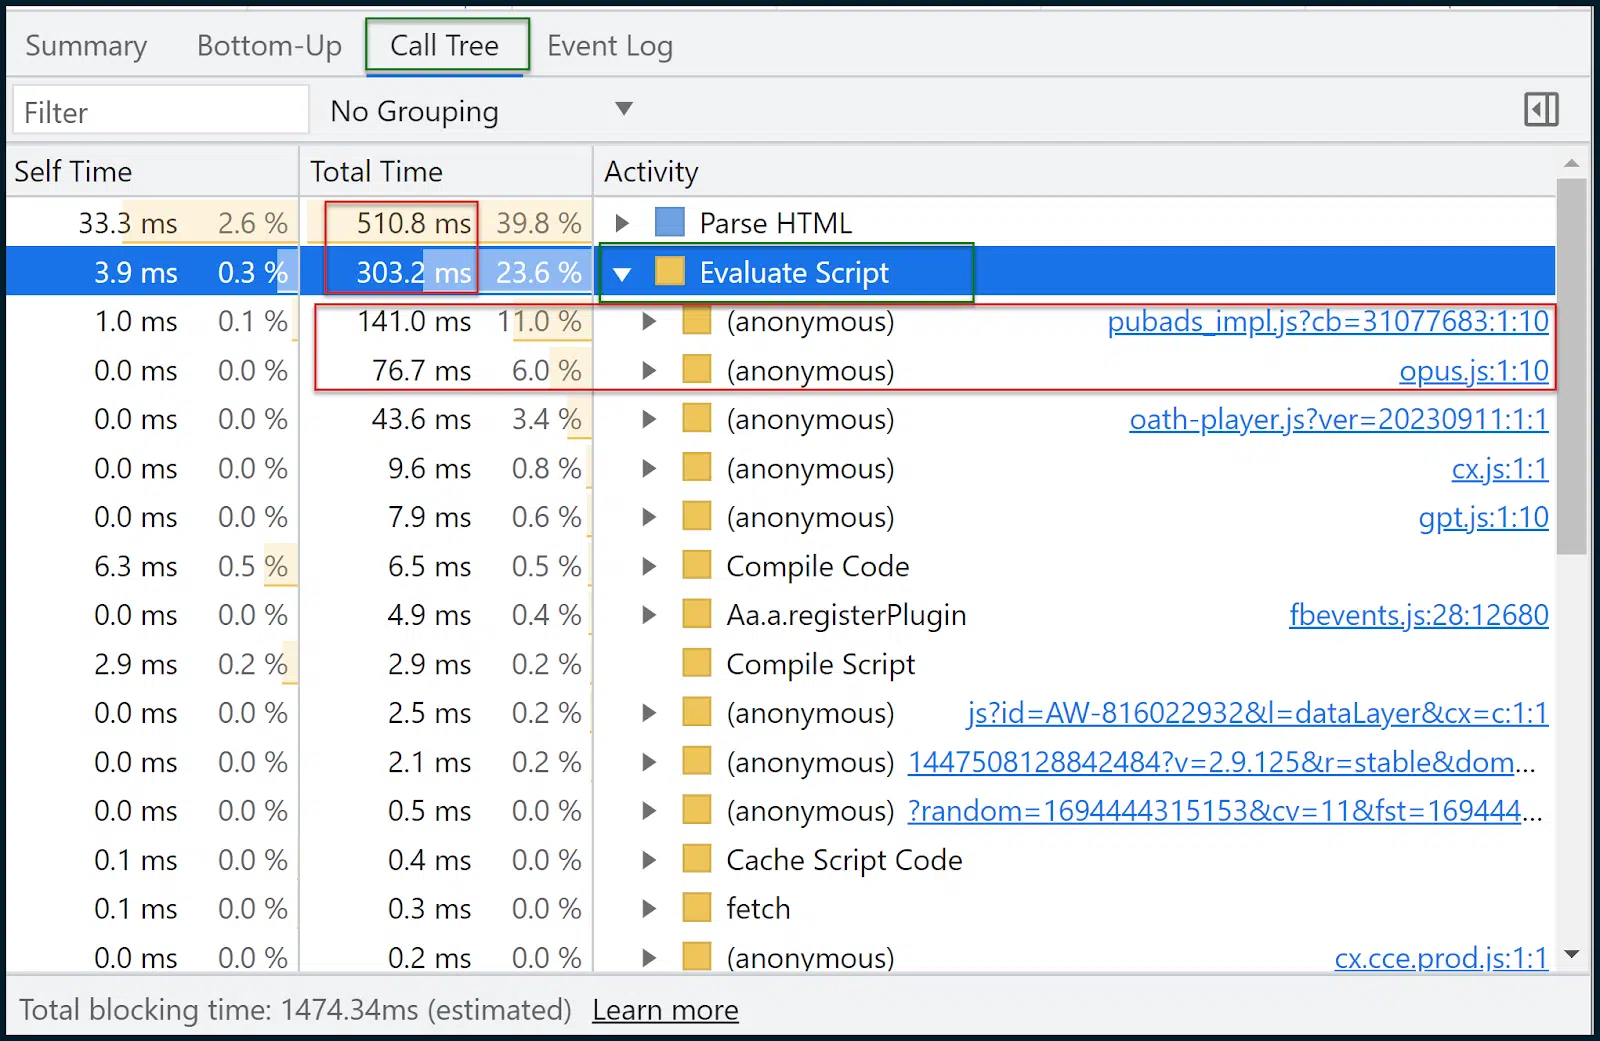
Call Tree is often more useful than Bottom-Up.
The data is similar, but Call Tree will thematically group tasks into handy buckets like Evaluate Script (script execution).
You can then click on a group, expand it and see the scripts and how long they took to load. 11% of the time was taken loading pubads_impl.jsm while 6% of the time was taken loading opus.js.
I don’t know what those modules are (and you may not either), but this is where the optimization journey often begins.
We can now take a step back to:
- Google these scripts and see if they are part of third-party libraries, what they do, and what the impact is.
- Consult the developer in terms of how these might be more intelligently deployed.
- Narrow the problem down to individual resources and look for alternatives.
- Tackle the performance deficit (or alternatively, fight for more resources/bandwidth, a strong hosting environment – if that is indeed required).
Other tools for measuring and optimizing for Core Web Vitals
If you managed to stick with me this far, congratulations. In terms of deep Core Web Vitals and page speed analysis, we only used:
- PageSpeed Insights
- Chrome DevTools (Performance tab)
Yes, you really can be just that lean. However, there are other tools which may be of immense assistance to you:
- GTMetrix: Especially useful for its waterfall chart (requires a free account for waterfall), which you can learn how to read here. Don’t forget that GTMetrix will run unthrottled by default, giving overly favorable results. Be sure to set it to an LTE connection.
- Google Search Console: If you set this up and verify your site, you can see lots of performance and usability data over time, including Core Web Vitals metrics across multiple pages (aggregated).
- Screaming Frog SEO Spider: This can be connected to the page speed API, to allow bulk fetching of Core Web Vitals Pass or Fail grades (for multiple pages). If you’re using the free page speed API, don’t hammer it in an unreasonable way
Improving your page speed ratings used to be as simple as compressing and uploading some images. Nowadays? It’s a complex Core Web Vitals crusade. Prepare to engage fully. Anything less will meet with failure.
Opinions expressed in this article are those of the guest author and not necessarily Search Engine Land. Staff authors are listed here.
Related stories
New on Search Engine Land
@media screen and (min-width: 800px) {
#div-gpt-ad-3191538-7 {
display: flex !important;
justify-content: center !important;
align-items: center !important;
min-width:770px;
min-height:260px;
}
}
@media screen and (min-width: 1279px) {
#div-gpt-ad-3191538-7 {
display: flex !important;
justify-content: center !important;
align-items: center !important;
min-width:800px!important;
min-height:440px!important;
}
}
googletag.cmd.push(function() { googletag.display(‘div-gpt-ad-3191538-7’); });
–>
Original Source: Measuring and optimizing for Google Core Web Vitals: A technical SEO guide