Key takeaways and findings from an analysis of seroundtable.com’s historical Google Analytics data from 2003 to 2023.
Are you a new search marketer looking to learn about the history of search?
Do you want to stay updated on the latest search marketing news?
If so, there’s only one person you need to “follow” to know 90% of the interesting changes in the industry.
This individual has a website; his first blog post was published on Dec. 2, 2003. The site’s Google Analytics (GA) code is tellingly short: UA-67314-1.
Several months ago, after a brief interaction on Mastodon, I was given access to his GA account to see if I could tell a story about the history of search through his work as the record-keeper of search marketing.
Looking at his posting patterns (Figure 1), it is clear that volume is no challenge. (I even double-checked this graph several times to ensure it was correct. Wow!)
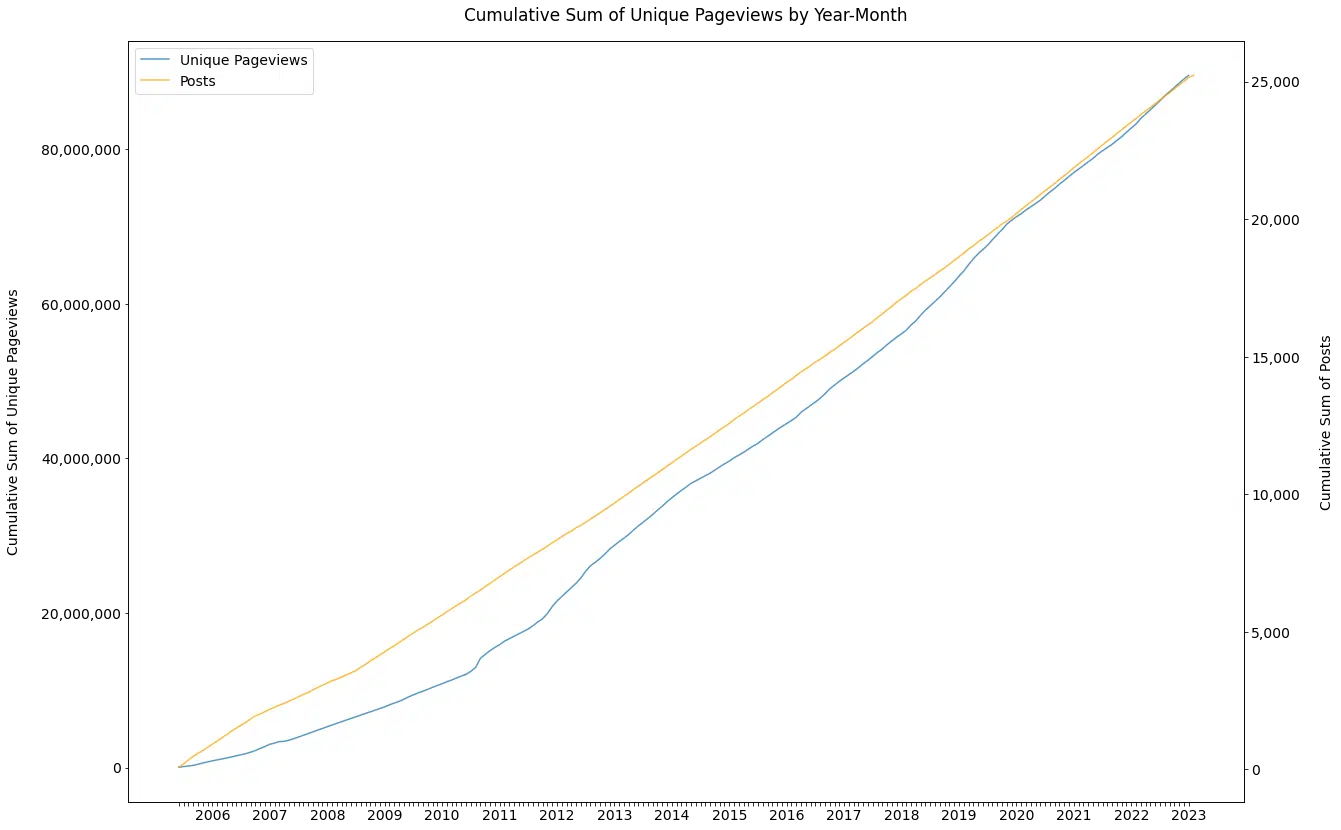
For the last 20 years, this person has posted, on average:
- 3.81 times per day.
- 26.67 times per week.
- 116.20 times per month.
- 1,437 times per year.
I am sure you have guessed it by now, but I’m talking about Barry Schwartz and his website, Search Engine Roundtable.
This article covers the key takeaways and findings from my analysis of seroundtable.com’s historical Google Analytics data.
(If you’re interested in how I analyzed the data and which tools I used, you can check out the methodology below.)
Search engine coverage through the years
Since we had data from 2003 and a prolific poster, we thought it would be interesting to look at the topic coverage that mentioned various engines in the titles of posts (Figure 2).
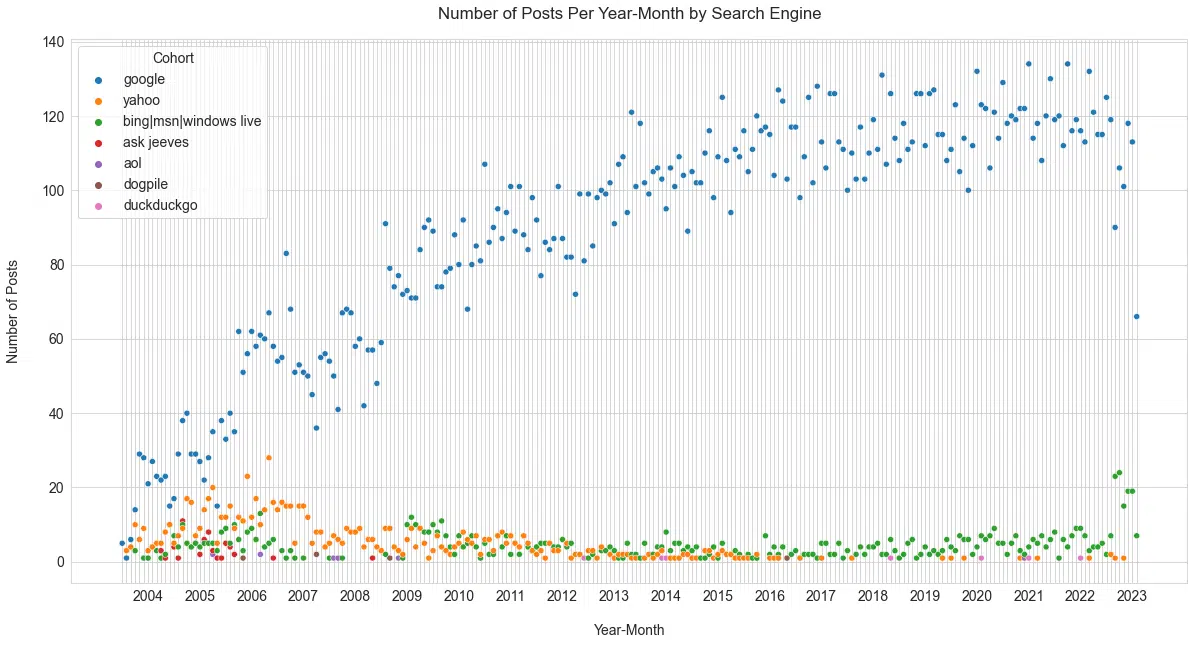
This figure tells the same story that we all know, Google is the most-covered search engine in the last two decades.
But it’s also interesting to note Yahoo’s death and the resurgence of Microsoft Bing. (While Microsoft Bing has seen a surge in coverage, it is not clear this is helping from a usage perspective, as reported in May.)
Looking at one person’s perspective of covering the “interestingness” of these products is a unique way of understanding their history.
Notably, most major U.S. search engines received minimal mentions over the past 13 years, except for Microsoft Bing, which gained sudden prominence recently due to Microsoft’s integration with OpenAI.
Looking at the average number of sessions per post and post frequency over time by search engine cohort (Figure 2), it is clear that the extensive news coverage greatly contributes to Google’s significance for this site’s audience.
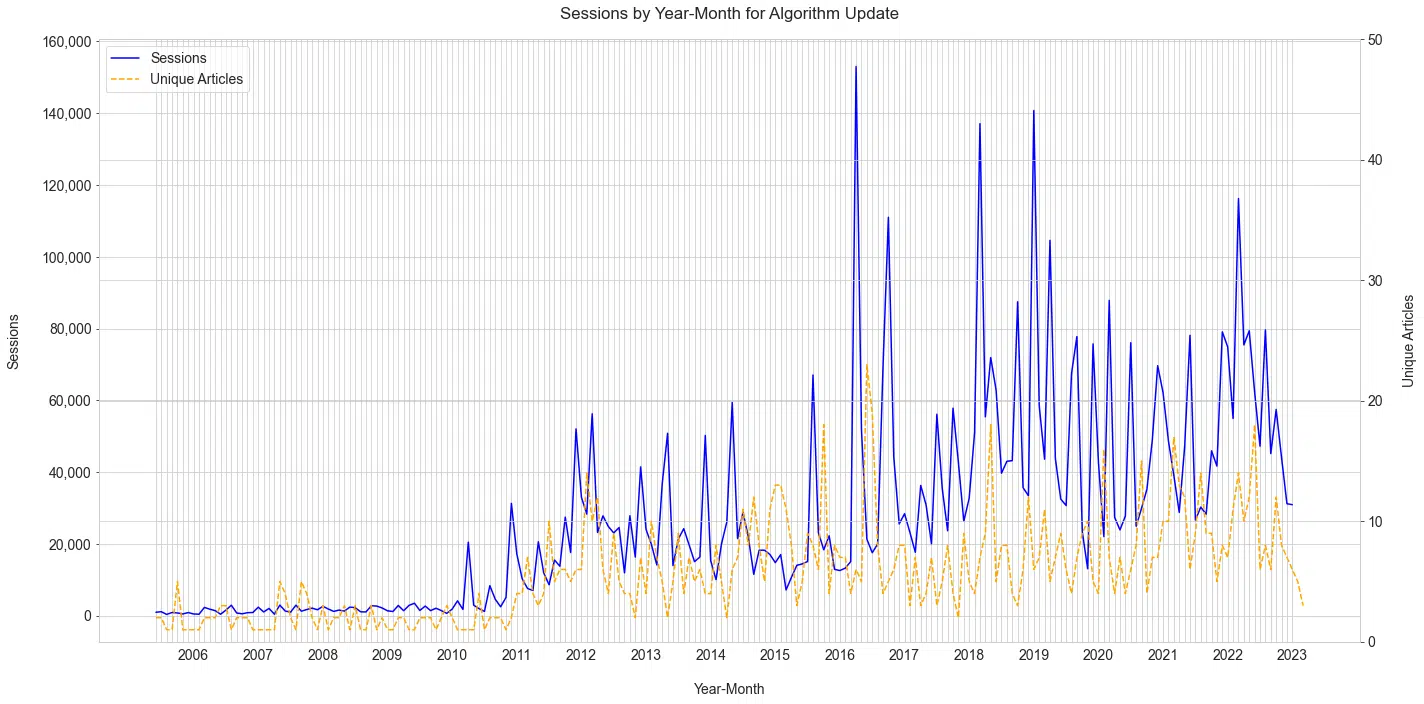
One important part of search engines is how frequently they improve their results. We can look back at the history of “algorithm updates” covered along with the search volume driven each month.
You’ll notice how the posts increase after the initial surge of traffic with an update announcement. The graph below paints a really interesting story of:
- How frequent updates are (at least major ones).
- Schwartz’s connection to and consistency of his coverage.
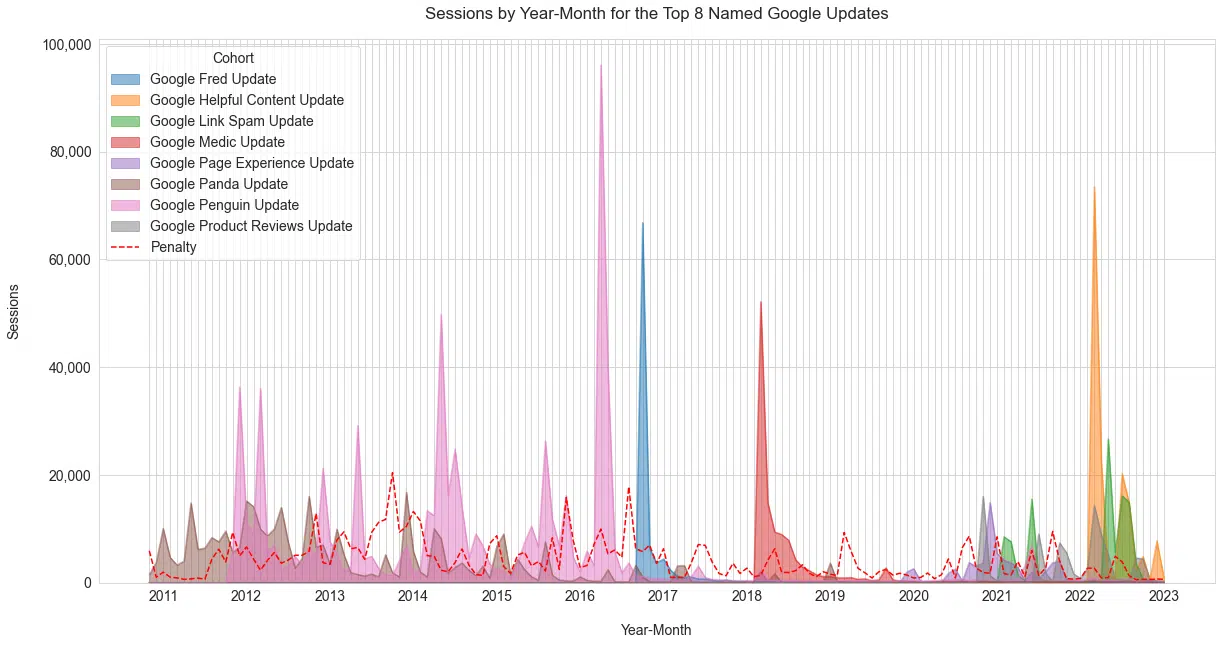
The impact and popularity of Google updates in the search community
We labeled roughly 20 named Google updates. The eight shown below are the top eight by overall sessions (Figure 4). We added the category “Penalty” to this chart, as this was a strong topic area in the time of Penguin.
While the topic is still discussed, its popularity has waned, as seen below. This shows the tremendous impact of Penguin updates on the search community.
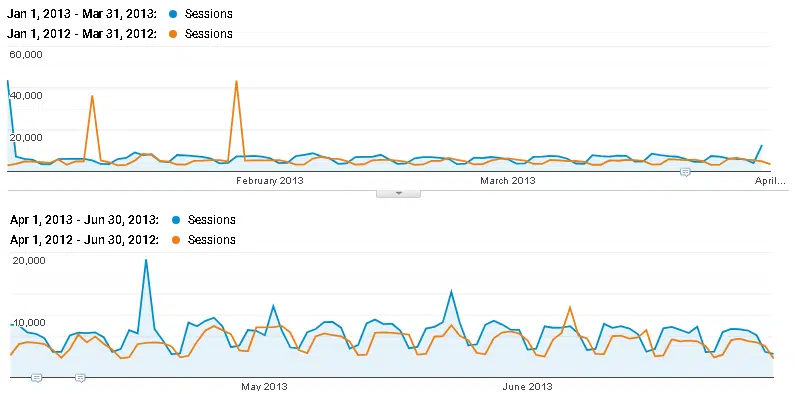
Interestingly enough, seroundtable.com had a manual action from Google from roughly 2007 through March 2013.
Schwartz wrote about it in 2011, and we can see annotations in his GA account that point to it being lifted in March and verified lifted via reconsideration request in April.
His Google/Organic session growth (YoY) for Q1 2013 was 16%, compared to 25% in Q2 (Figure 5).
New user growth grew 22 percentage points. Despite this, the impact is dubious due to outlier spikes of interest favoring the second quarter.
Schwartz, from his post on the penalty (and his sponsorship links), said:
- “I am stubborn and I am one of the few SEO blogs that decided to not change when Google unleashed their penalty.”
Years later, he reconsidered. (Many details are now missing in GA, but the manual penalty likely didn’t have a drastic impact.)
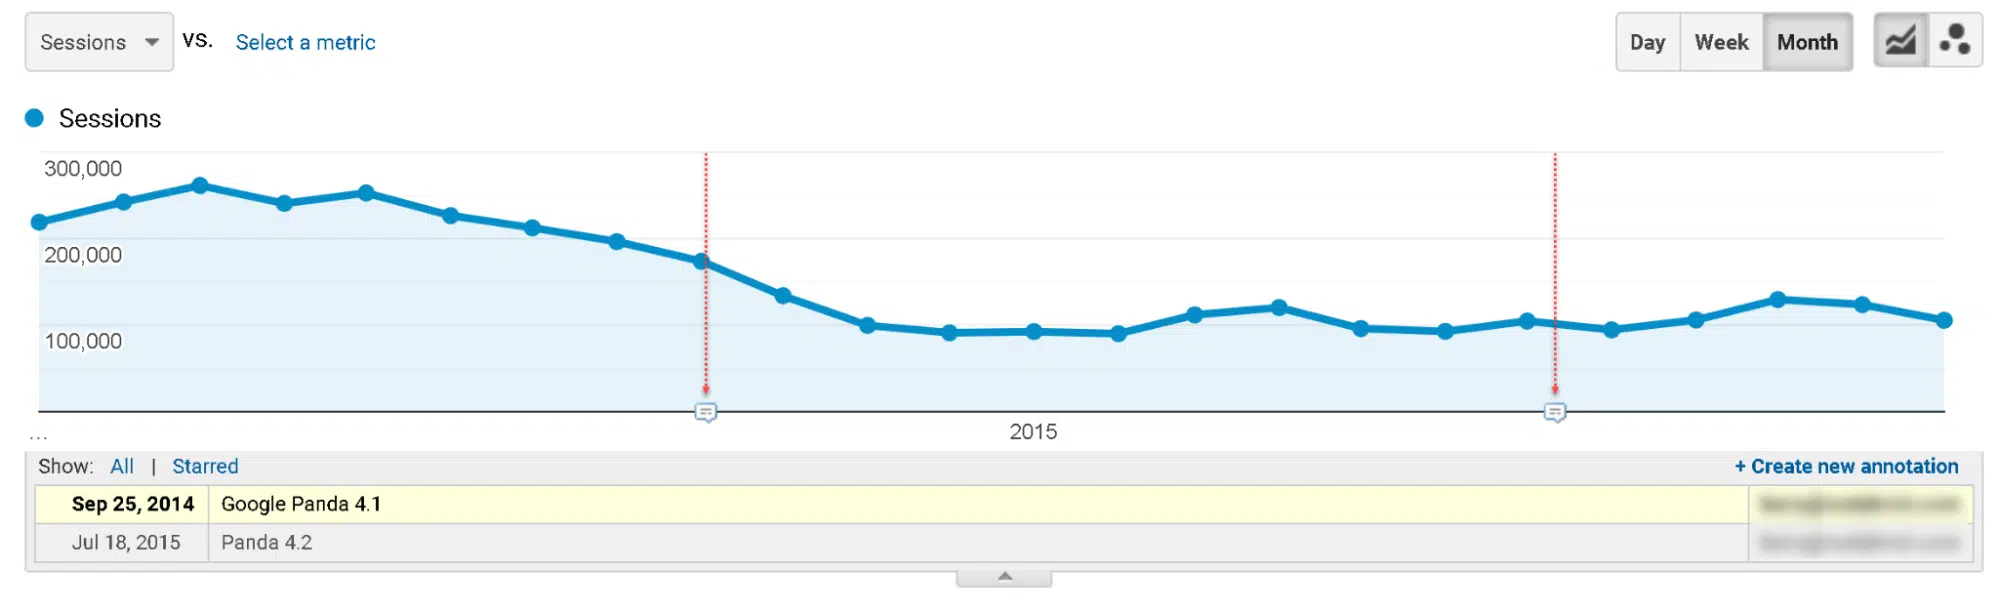
Seroundtable.com also fell victim to the Panda 4.1 update in 2014 (Figure 6).
As Schwartz indicated in 2015, performance started improving modestly with Panda 4.2 mid-2015 up until May 2020, when there was another sudden decline.
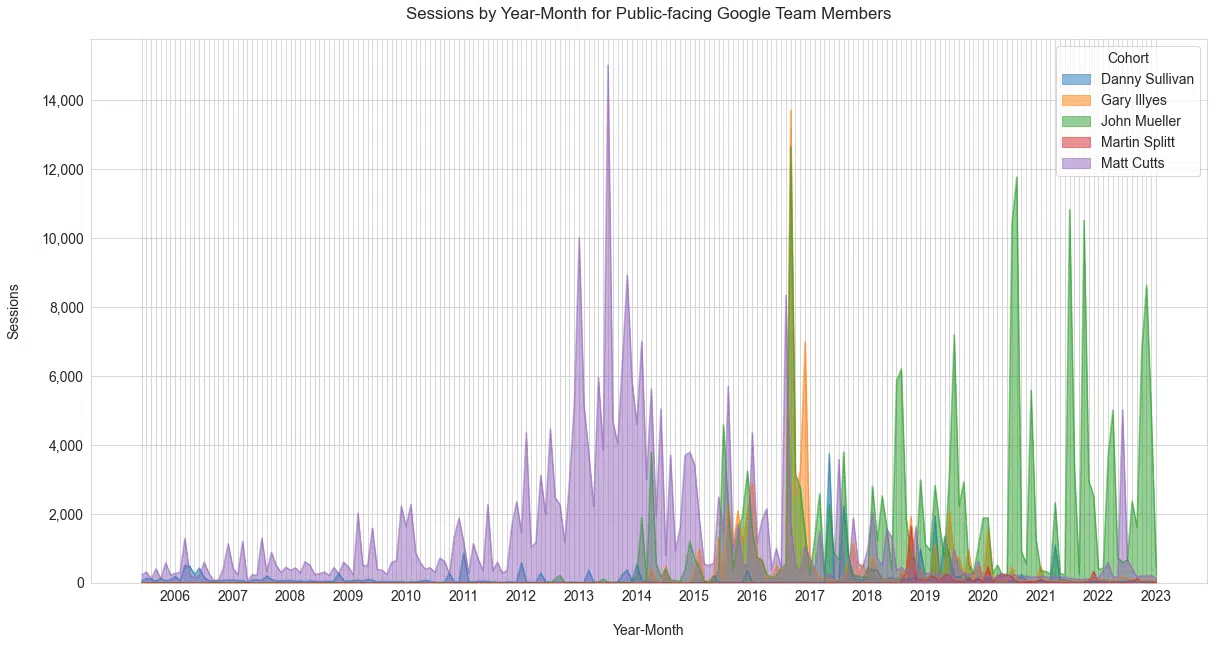
Google team members
We identified 10 Google employees mentioned in the titles of posts (Figure 7).
Of the 10, we restricted the list to show only those regularly communicating information to the SEO community.
This is my favorite view as it clearly shows the Matt Cutts vs. John Mueller eras.
As the Public Liaison for Google Search, Danny Sullivan is not as pronounced in the posts. It’s important to note that any mentions of him before late 2017 would refer to his previous role before taking up this position.
As the founder of Search Engine Watch and later the founding editor of Search Engine Land, Sullivan is undoubtedly an integral part of SEO’s history.
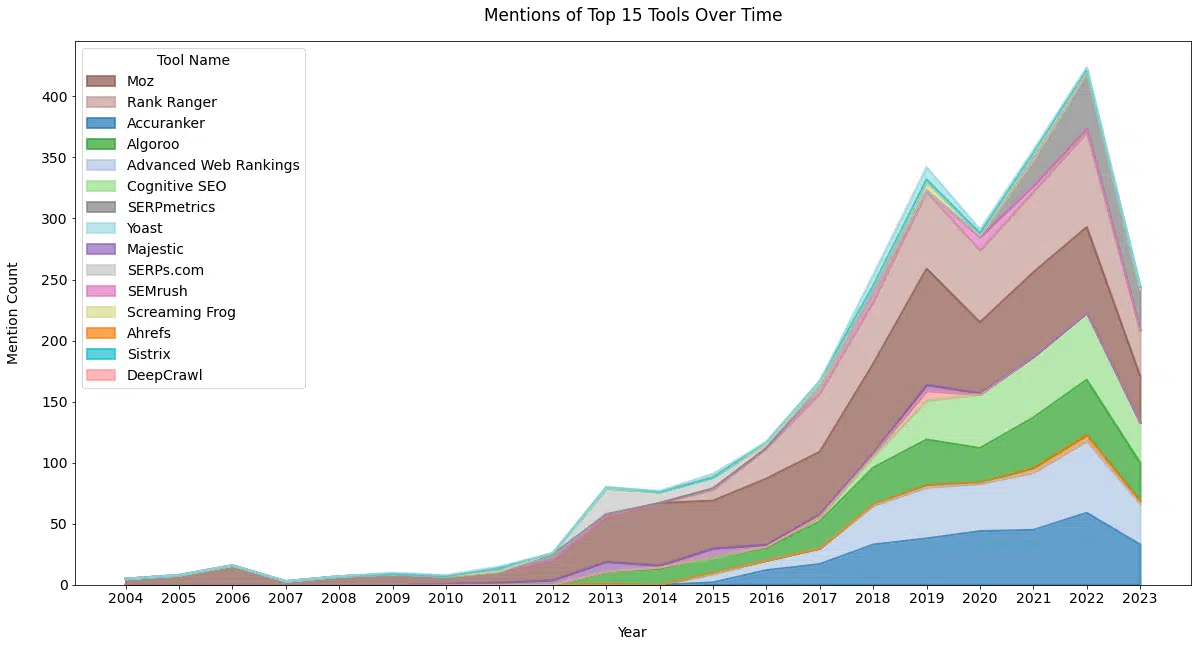
SEO tool coverage
The SEO industry has no shortage of tools. Reviewing Schwartz’s posts, we can see that he has mentioned a wide range of tool companies over the years.
While posts devoted to a particular company are fairly rare, Schwartz has covered data studies and product announcements.
Below (Figure 8a), we can see the frequency of coverage in posts since 2003. This data differs from other data in this article as it considers mentions in the article title and content.
| Tool Name | Mention Count |
| Moz | 924 |
| Rank Ranger | 561 |
| Accuranker | 297 |
| Algoroo | 292 |
| Advanced Web Rankings | 289 |
| Cognitive SEO | 232 |
| SERPmetrics | 116 |
| Yoast | 91 |
| Majestic | 53 |
| SERPs.com | 46 |
| SEMrush | 44 |
| Screaming Frog | 34 |
| Ahrefs | 29 |
| Sistrix | 21 |
| DeepCrawl | 20 |
| SimilarWeb | 13 |
| SE Ranking | 12 |
| HARO | 9 |
| SERPStat | 7 |
| SERPWoo | 6 |
Historically, we can see the benefit to tool vendors of creating aggregated ranking metrics like Mozcast.
Frequent and growing mentions with each ranking fluctuation. It is also clear here the staying power that Moz has.
Top posts
The following table (Figure 9) shows the top post for each year by unique pageviews.
There is content with broader appeal (outside of the SEO community), and content that is more narrowly targeted to search engine marketers.
I wonder how he decides this balance? I was surprised a bit by this list, but it makes sense.
| Year | Title | Unique Pageviews |
| 2005 | First Ever Wedding Proposal via Search Engine | 3,568 |
| 2006 | Google Earth – Free Download | 50,669 |
| 2007 | Google Earth – Free Download | 44,214 |
| 2008 | Google Earth – Free Download | 64,097 |
| 2009 | Scam: Google Money System or Google Kit | 88,657 |
| 2010 | How to Set Up Google AdSense Video Units via YouTube | 78,537 |
| 2011 | How to Set Up Google AdSense Video Units via YouTube | 148,083 |
| 2012 | Google Celebrates the First Drive-In Movie Theater | 126,629 |
| 2013 | Google Maps Murder at 52.376552,5.198303 in Netherlands | 265,977 |
| 2014 | Google Maps Murder at 52.376552,5.198303 in Netherlands | 110,222 |
| 2015 | Google Analytics Changes Terminology: Sessions & Users Replace Visits & Uniques | 68,565 |
| 2016 | How to Get a Location’s Longitude/Latitude Using Google Maps on iPhone | 129,300 |
| 2017 | Big Google Algorithm Fred Update Seems Links Related | 175,488 |
| 2018 | You Can Now Opt to Remove Trending Searches in the Google Search App | 125,922 |
| 2019 | You Can Now Opt to Remove Trending Searches in the Google Search App | 181,556 |
| 2020 | Google Logo Says Thank You Coronavirus Helpers | 413,202 |
| 2021 | You Can Now Opt to Remove Trending Searches in the Google Search App | 103,498 |
| 2022 | Google Helpful Content Update to Target Content Written for Search Rankings | 226,842 |
| 2023 | Google Maps Murder at 52.376552,5.198303 in Netherlands | 55,533 |
Figure 9
Comments
Seroundtable.com has, as far as I know, always allowed comments, and the SEO community loves to share opinions about Google’s shenanigans.
This view (Figure 10), suggested by John Mueller, shows posts over time by unique page views and comments (bubble size).
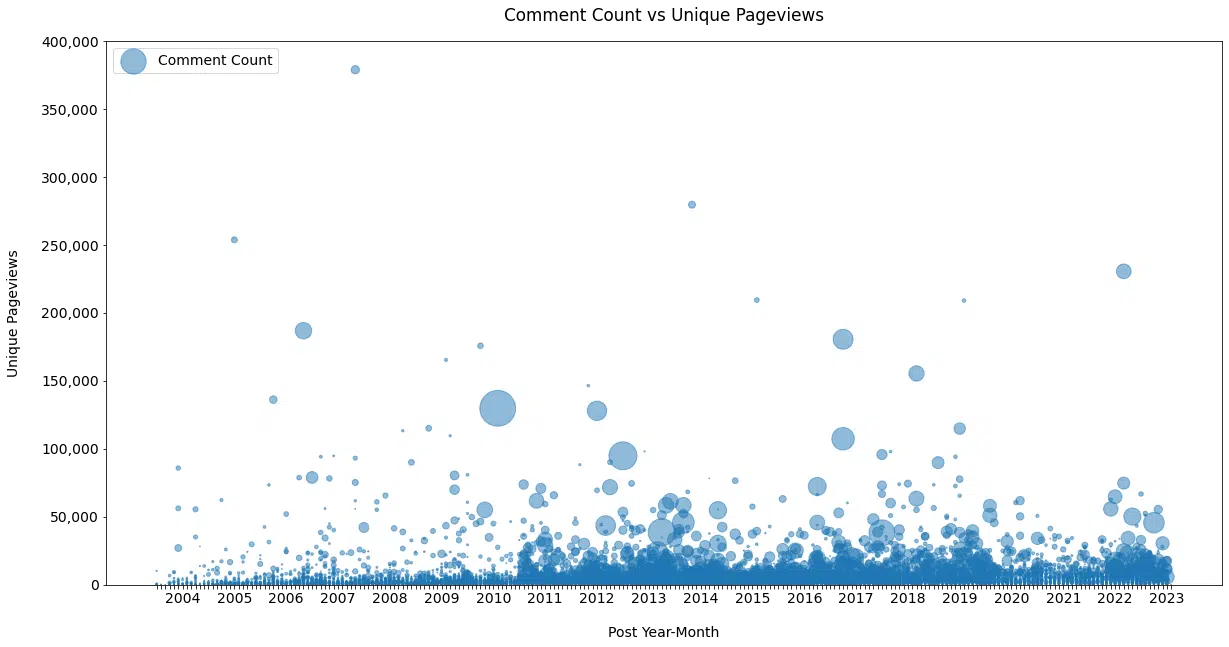
This gets interesting if we look at the data by topic category.
For example, let’s compare content on “Google Updates” with content on “Paid Advertising” (Figure 11a and 11b).
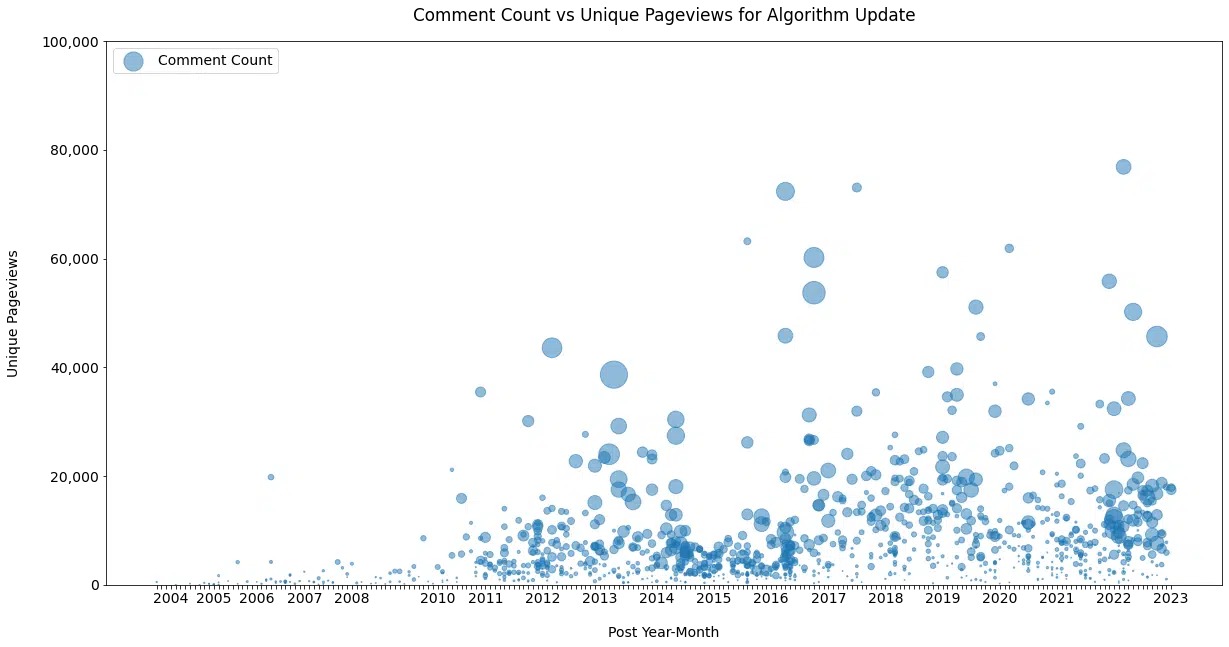
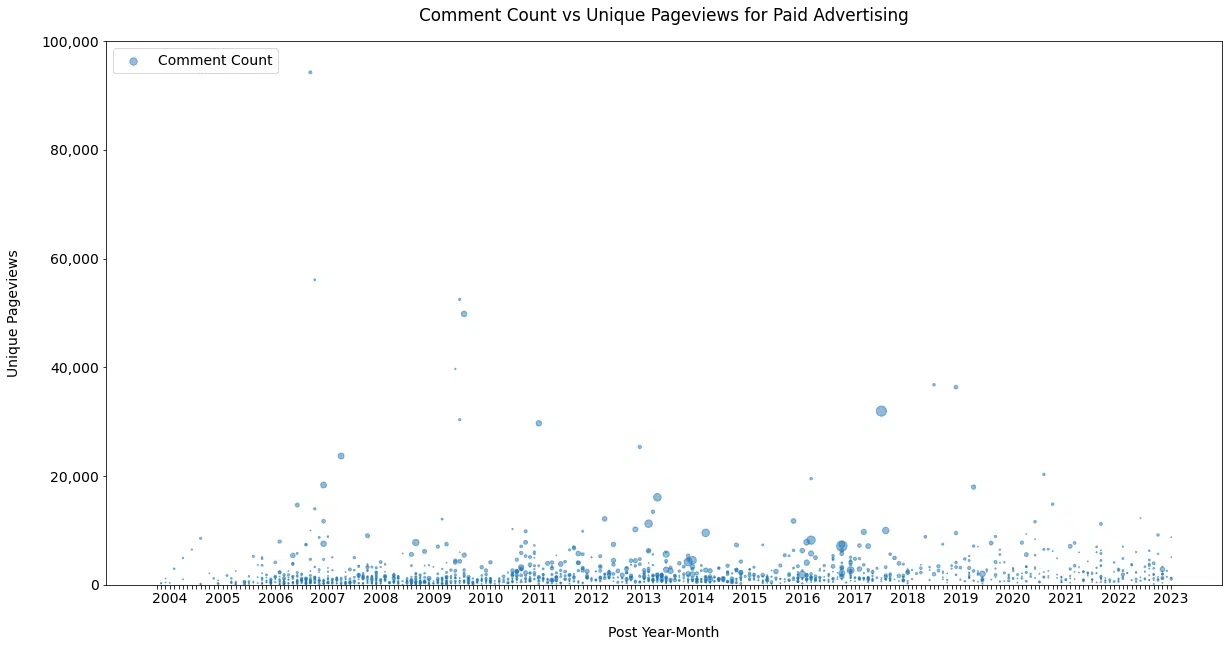
It is much less heated over on the paid side, but it shows the heightened level of interest, emotion, and interaction for posts covering changes that can potentially erase months or years of effort.
Links
Schwartz is not shy about linking to others.
As mentioned earlier, Schwartz reluctantly added a nofollow attribute to sponsorship links years after receiving a modest penalty from Google in 2007.
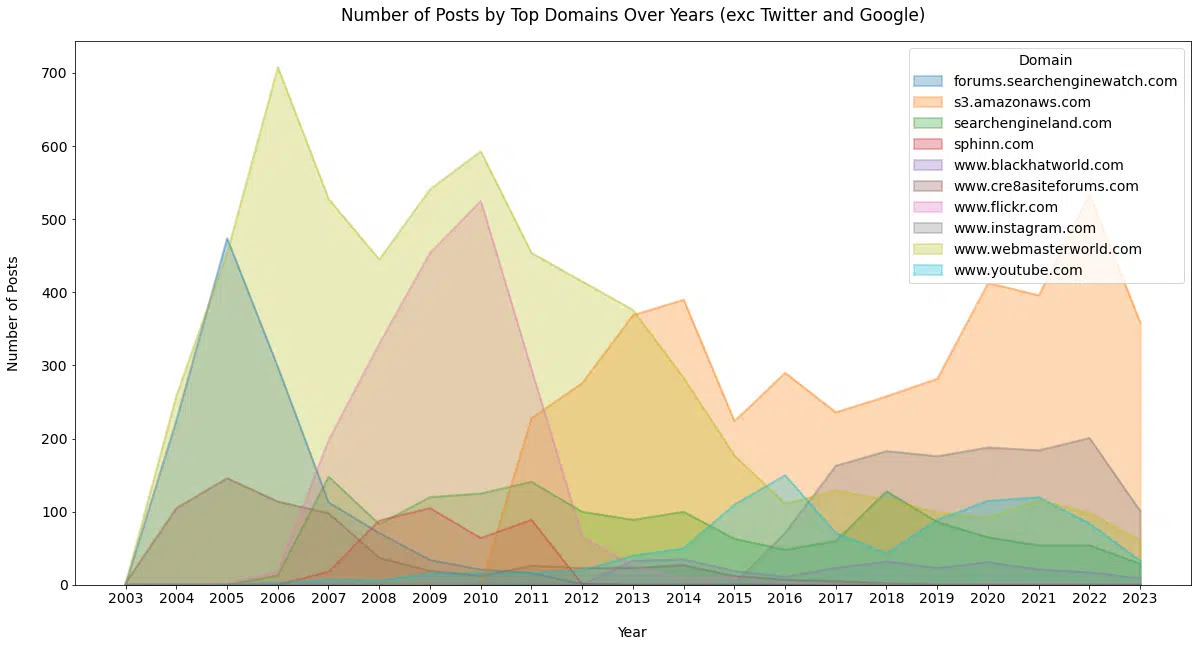
Schwartz has linked from his post content to nearly 4,000 unique domains over the last 20 years (Figure 12).
This graph shows the top 10 linked domains from the dataset, clearly illustrating the value Twitter has provided to Schwartz for surfacing information to write about over the last 10 years.
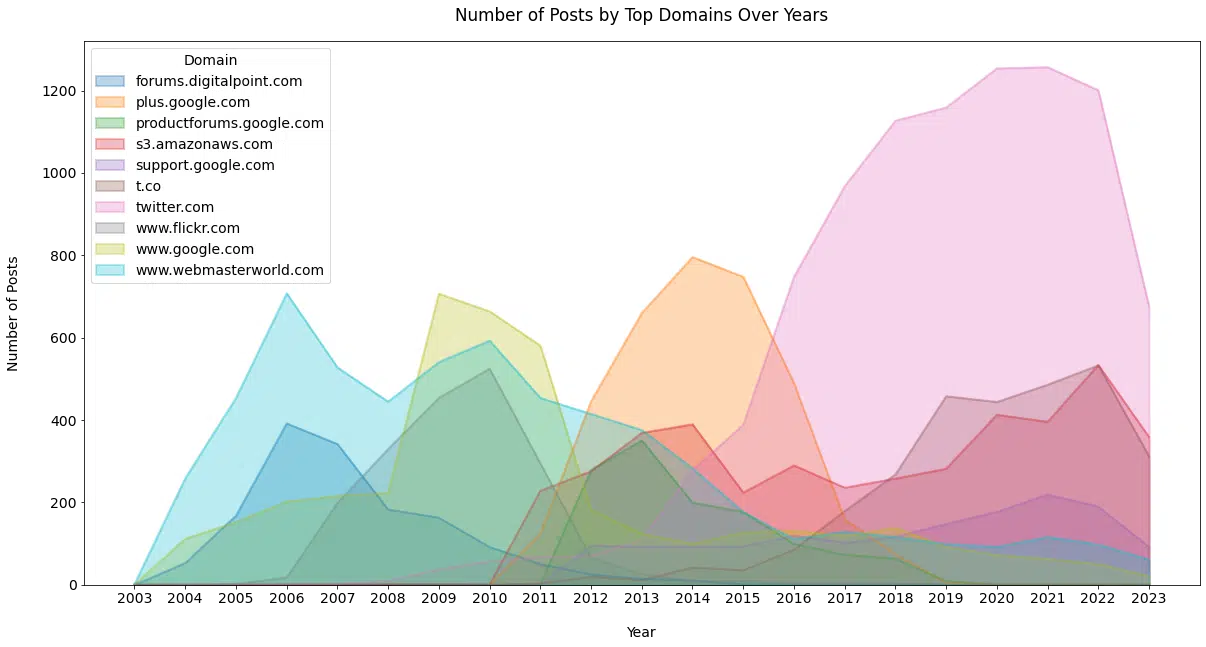
The next chart removes Twitter and Google and does the same thing (Figure 13).
We start to see a few sites that newer SEOs may be unaware of, but many might remember with varying degrees of fondness.
function getCookie(cname) {
let name = cname + “=”;
let decodedCookie = decodeURIComponent(document.cookie);
let ca = decodedCookie.split(‘;’);
for(let i = 0; i <ca.length; i++) {
let c = ca[i];
while (c.charAt(0) == ' ') {
c = c.substring(1);
}
if (c.indexOf(name) == 0) {
return c.substring(name.length, c.length);
}
}
return "";
}
document.getElementById('munchkinCookieInline').value = getCookie('_mkto_trk');
Data visualization of search trends over time
Here is a fun racing bar chart showing the top categories over the last 20 years (Figure 14). This serves as a reminder of the influx of panic within the SEO community during Google updates.
To a certain extent, this brings comfort, as even though SEO is rapidly changing, it has always been that way.
Figure 14 (See the full animation here.)
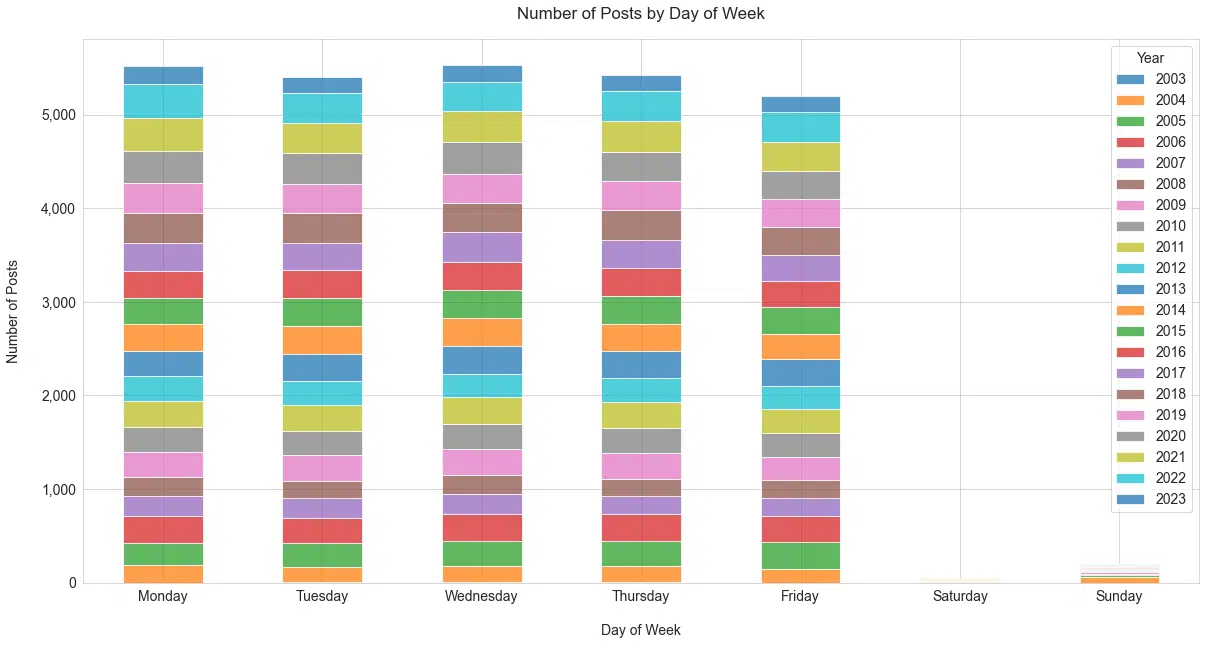
Schwartz posts like a robot
I thought something interesting here could be used to point to where a certain day was prioritized for posting, but no.
Posting just as it happens, and it happens a lot.
I mention that Schwartz is a robot based on the extraordinary consistency he has shown in posting over many years.
I have had difficulty committing to the same project for over six months, so 20 years is beyond amazing (Figure 15).
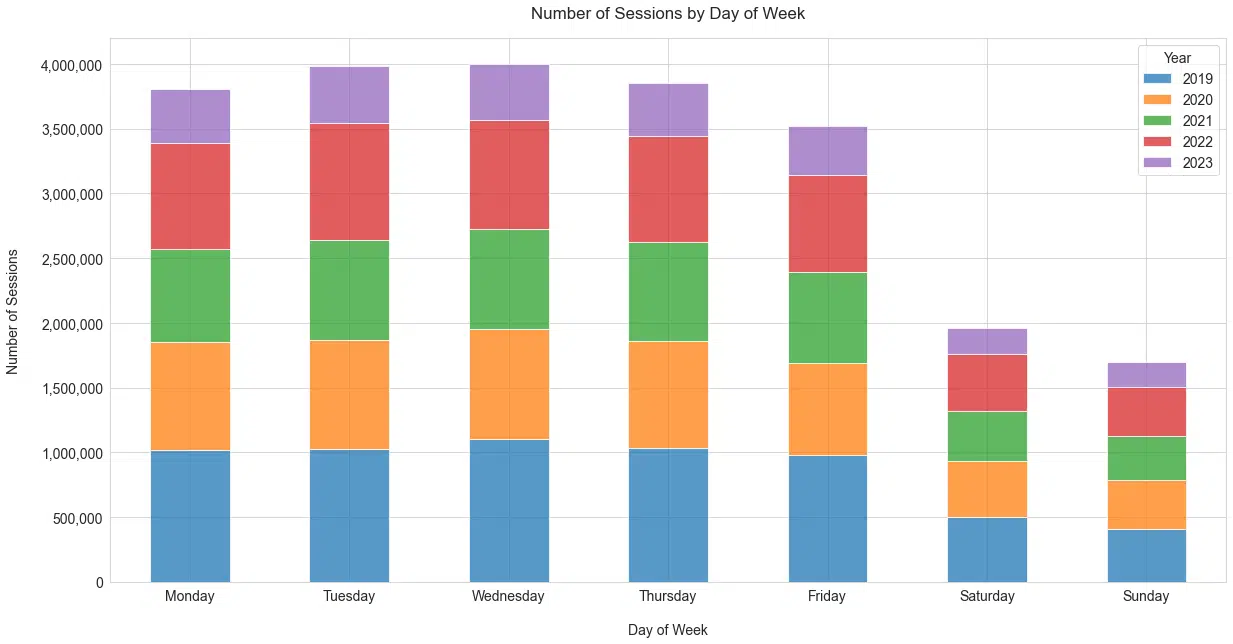
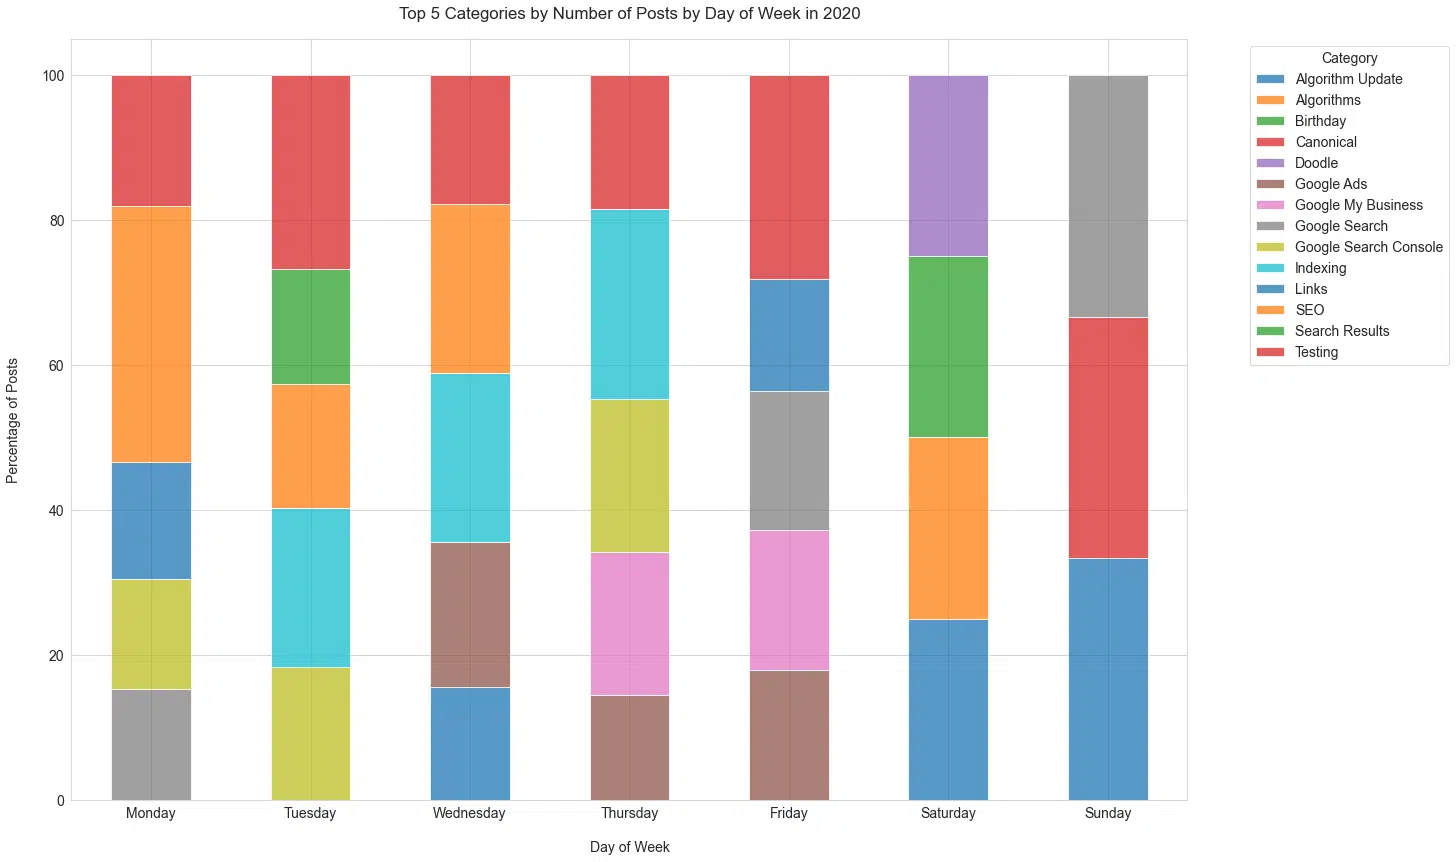
For balance, here is the number of sessions by day of week (Figure 16). I guess it really doesn’t matter, although mid-week is the clear winner.
Looking at the types of posts published in the last several years, there doesn’t seem to be a large difference between the types of posts on weekdays (Figure 17).
Where we do see differences is on Saturday and Sunday, which are days that usually involve temporal events of strong importance.
Schwartz has historically posted rarely on Saturday and Sunday, with 0.74% and 0.17% of all posts, respectively.
This makes sense intuitively since he would be more likely to break from his weekend for items that are really important to cover.
Important categories and word count
These are the top categories out of the ones reviewed based on slope (Figure 18). For reference, a slope is a measure that describes the direction and steepness of the line.
One reason these categories perform so well from a traffic perspective may be that this type of content breaks out of the typical SEO world bubble and into the general population of interest around Google.
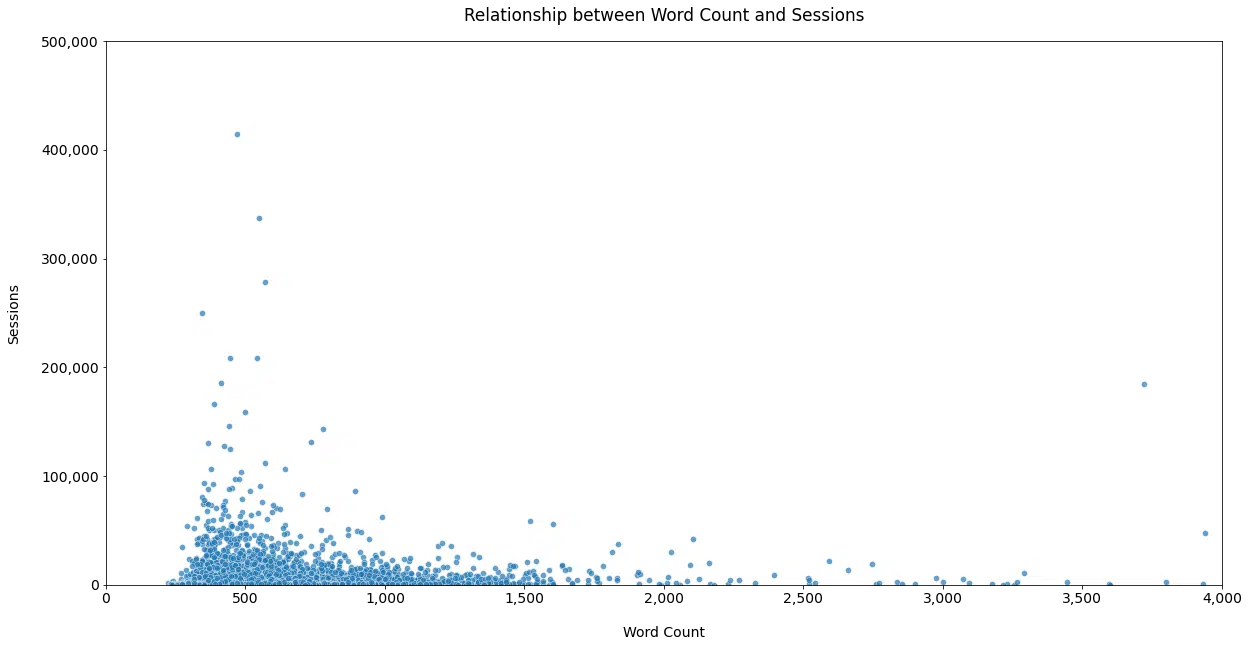
Schwartz has often stated that he cares more about getting the news out than the depth with which it is covered.
This is supported by data when looking at the relationship between sessions and word count (Figure 19).
How Schwartz’s readership reflects the SEO industry and interest in different segments
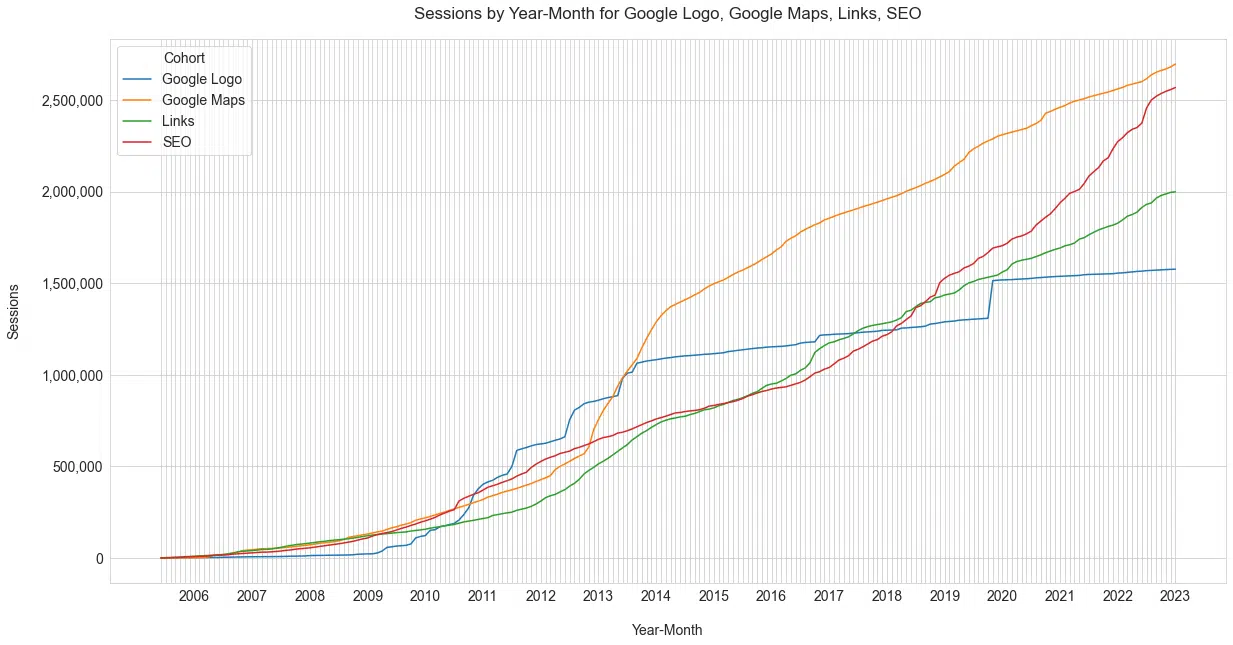
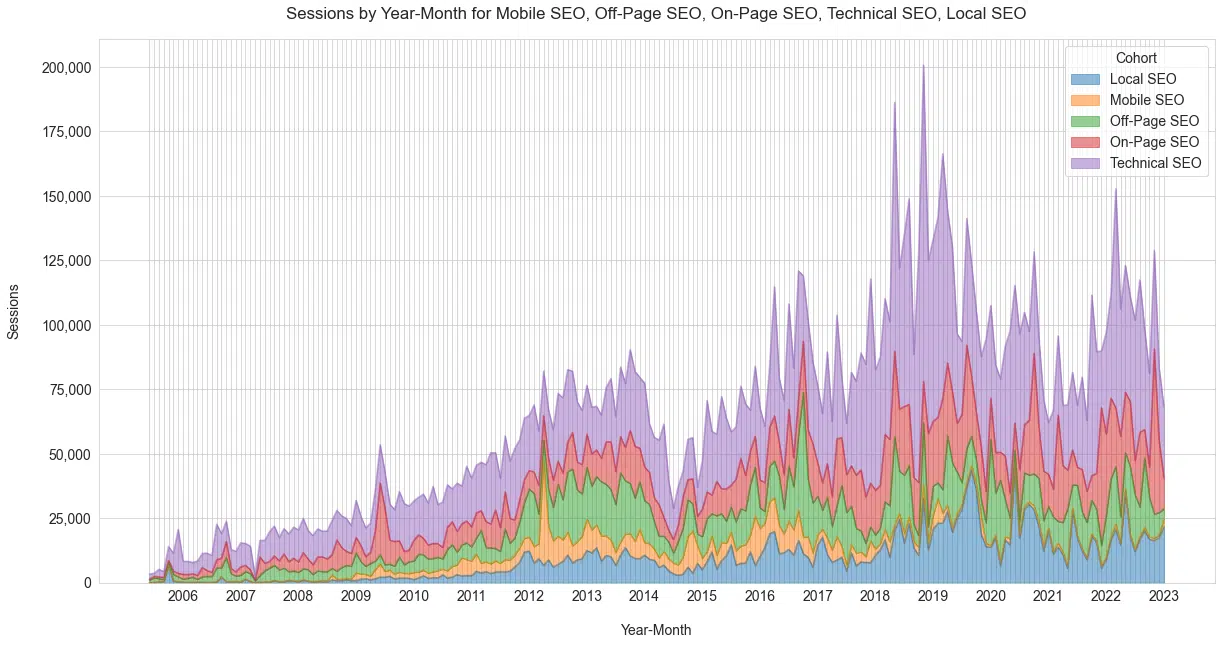
SEO sub-sections
This is where the categories may get me into trouble.
At a high level, here is the relative interest in the SEO industry with respect to followers and readers of Schwartz for the four major segments of SEO (Figure 20).
As pointed out by Mueller, you can see the decade of mobile nicely.
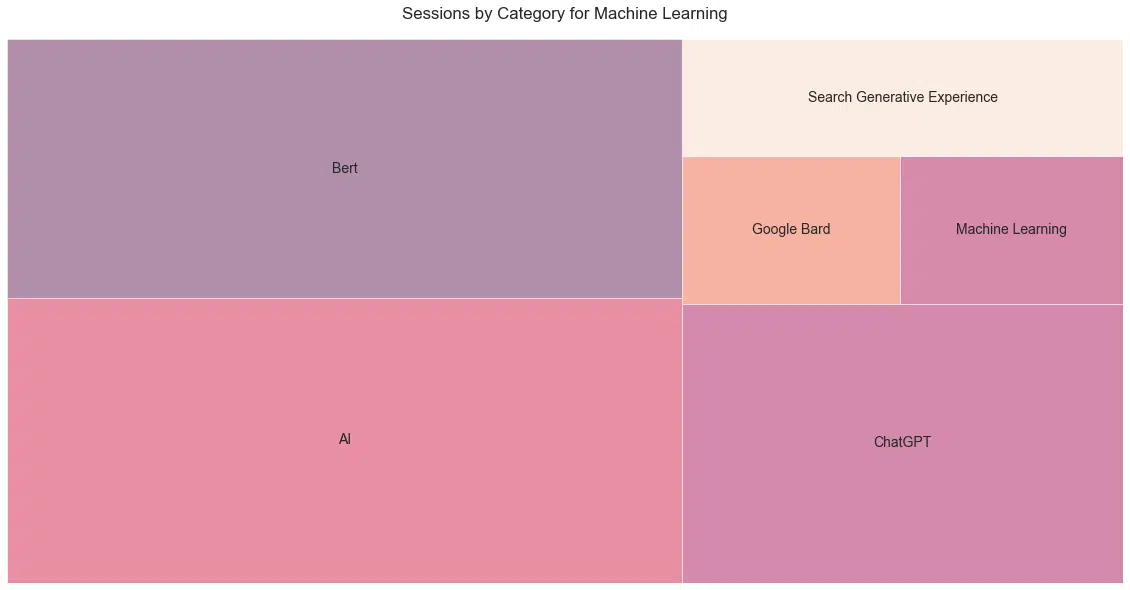
AI and SEO
OK, I just wanted to do a treemap, but this is a cool view of the total sessions by posts from the “Machine Learning” category (Figure 21).
Please note that this is the total sessions of the best post in each category. This should control for the relative newness of some of the categories.
I find it fascinating that the entrance to the lexicon of BERT had a larger impact than recent machine learning changes.
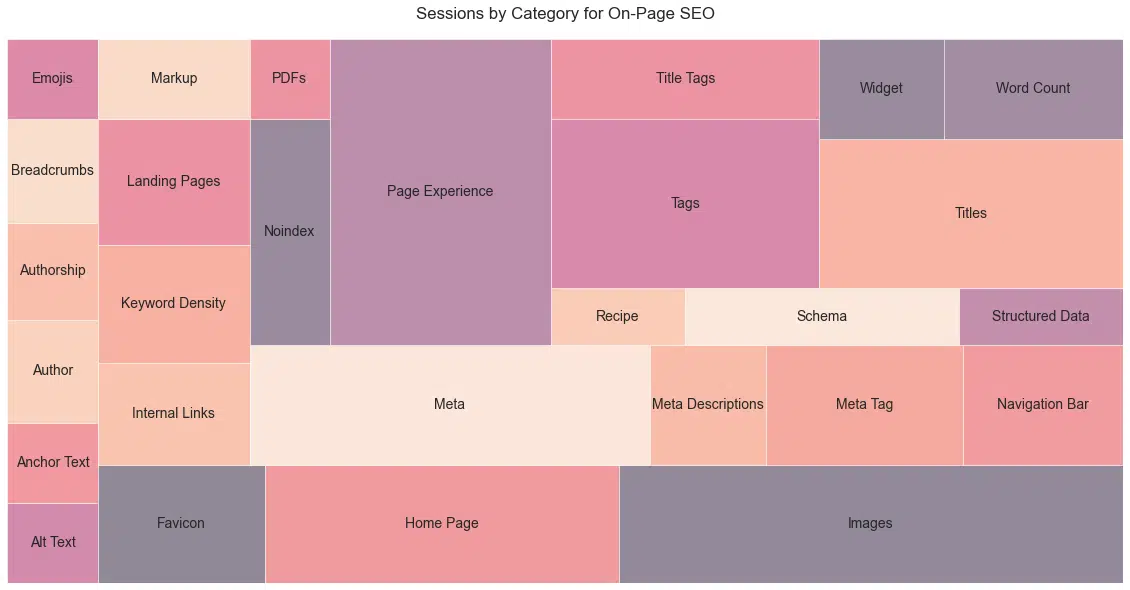
SEO hero
For all you on-page gurus out there, here is the comparative level of interest for members of this category based on the sessions of the best-performing post (Figure 22).
A note here that “Meta” may be inflated due to matches to the company, Meta (Facebook).
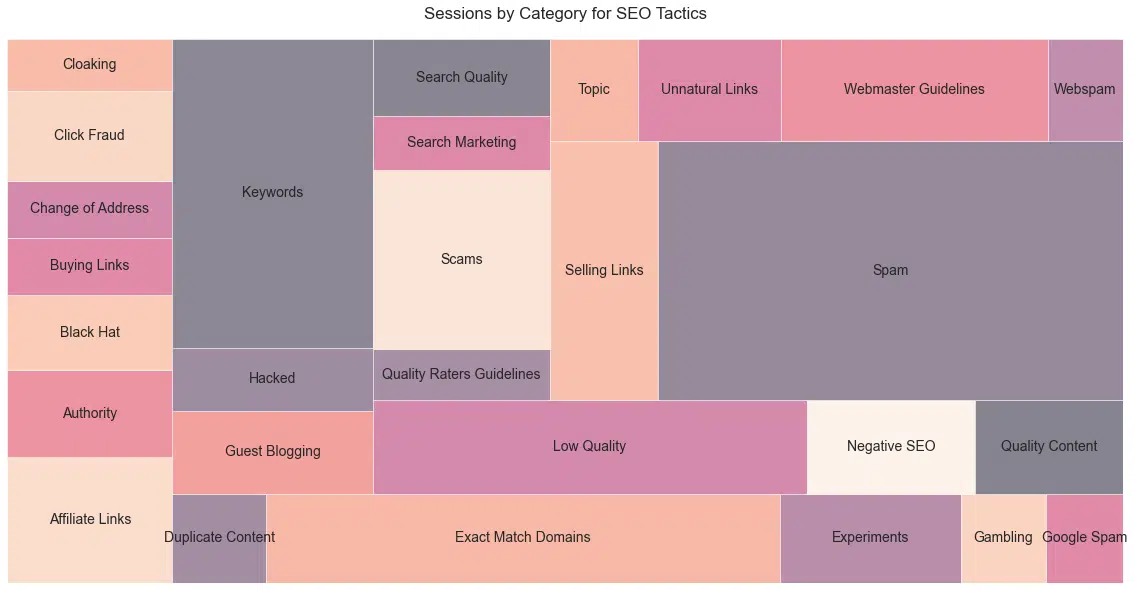
Here are the top categories by tactic (Figure 23). As this is over the span of 20 years, a number of these tactics could actually get a website penalized.
This does show well the checkered past of SEO and the nature of Google’s PR pushes to call out tactics that attempt to game their system or harm others.
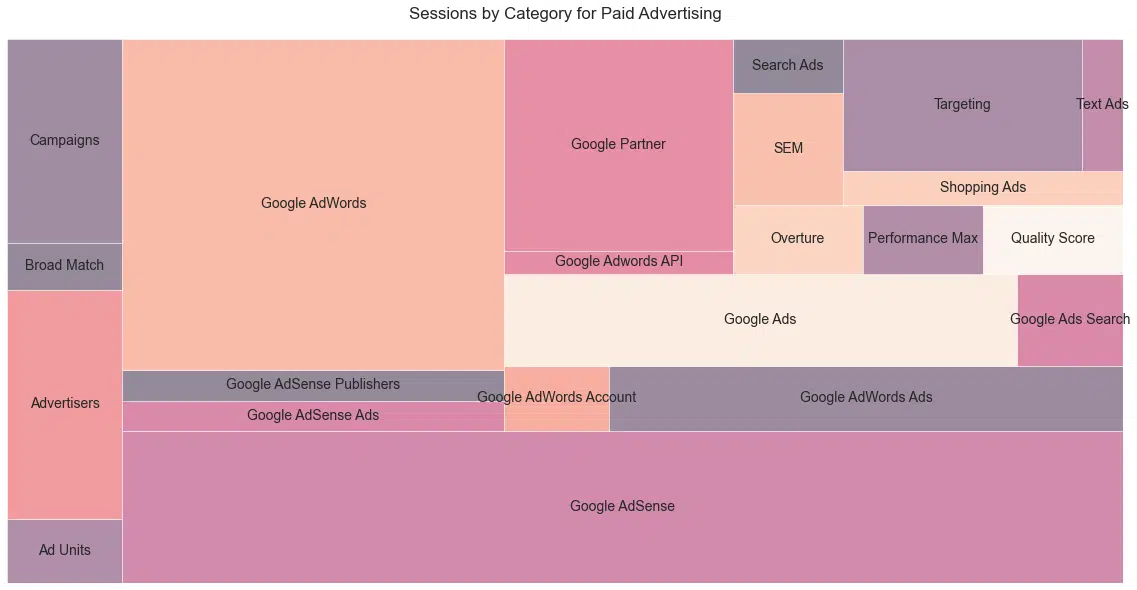
Paid
For my friends on the paid side, here are the members of the “Paid Advertising” group of posts. (Figure 24). Who remembers Overture?
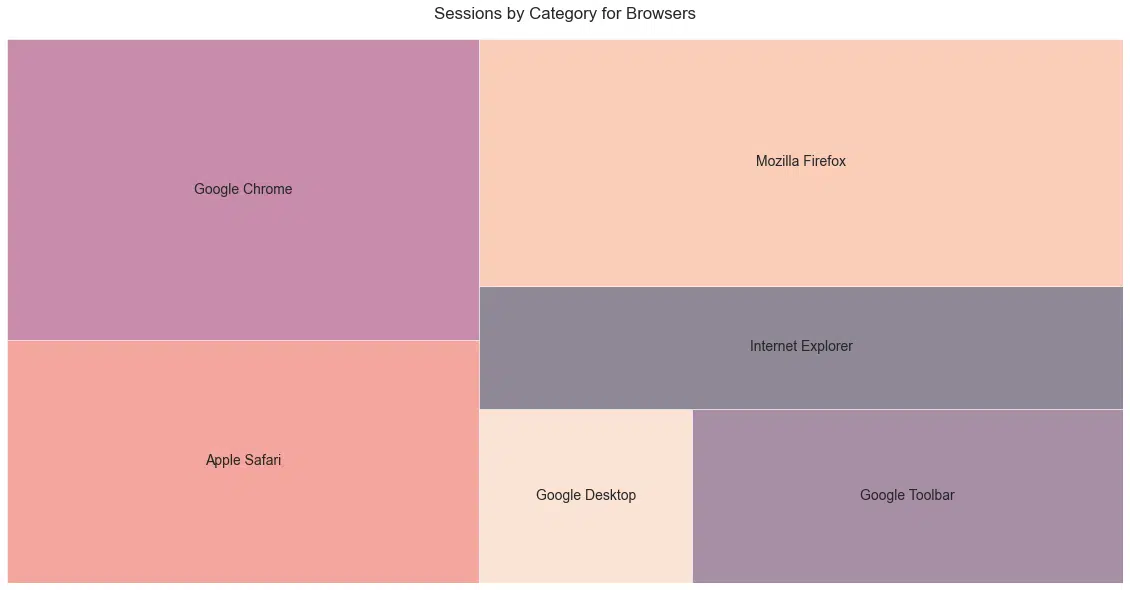
Browsers
This was surprising to me based on how much Google is covered on this website and how lopsided Google’s market share is (62.85%), but hats off to Schwartz for the even coverage (Figure 25).
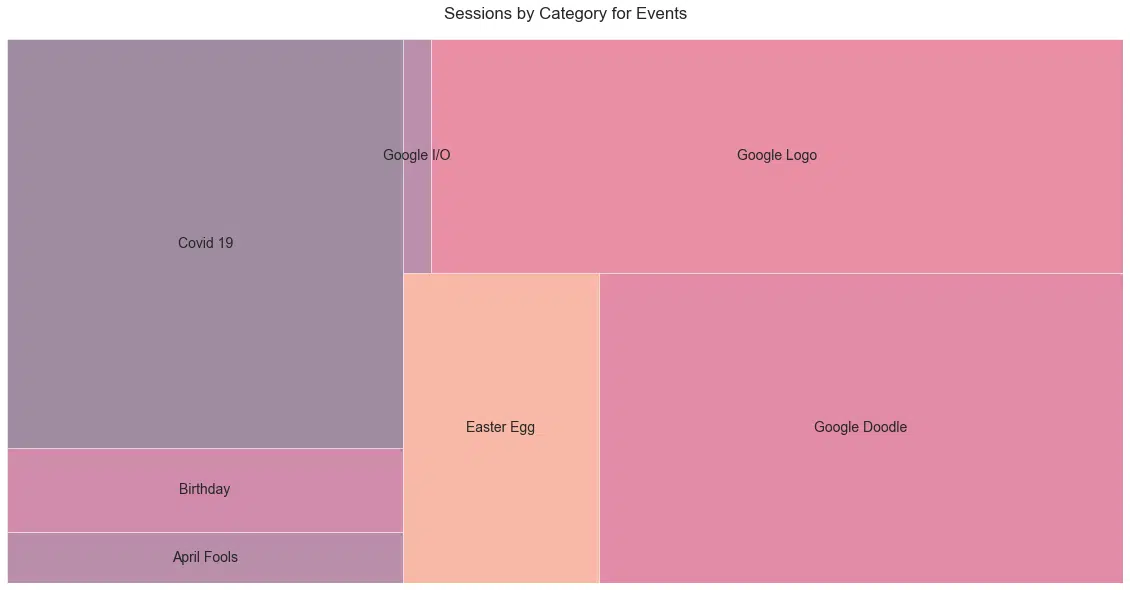
Events
Some earlier posts in history promoted specific conferences like SMX, but this was over a relatively short period, so they were removed from the dataset.
Interestingly, dominant COVID-19 content, which lasted a year or so, was compared to other categories over 20 years (Figure 26).
Also, we definitely need more Easter eggs from Google. Schwartz told me he used to do live blog events but stopped over a decade ago.
I removed most (all?) of the titles from the dataset that didn’t have at least some mention of a relevant topic (e.g., vlog episode #1234 Weekly Roundup is an example of one that would be removed).
Schwartz also mentioned he stopped covering Google logos when other publishers started covering them.
“They lost their fun.”
How cool is it to do something so driven by passion and not clicks?
The history of search in 32,926 posts and counting
It is interesting to go back and recount all that has changed in the industry and get to know the “wild west” days of search.
And we have Barry Schwartz to thank for 20 years of covering the industry without fail.
If it involves search marketing, we know Schwartz has more than likely seen or covered it.
That’s not new.
I want to thank John Mueller and Patrick Stox for their recommendations and sanity checks on the information and data provided here. Danny Sullivan also reviewed for an additional sanity check.
The data and methodology
I started by crawling seroundtable.com in Screaming Frog, carefully pulling post meta content like Author, Post date, and Category using custom extraction. I also pulled GA data, although since this was from 2005, I knew this wouldn’t be enough. The HTML data was outputted to a CSV for further processing.
Since there are many authors on seroundtable.com, I limited the rest of the analysis only to posts written by Schwartz (he wrote more than 32,000 of them).
To better understand how much Schwartz has contributed to the website, here’s a quick look at the top 10 authors and how many articles are attributed to them (Figure 27).
| Author | Articles |
| Barry Schwartz | 32,786 |
| Tamar Weinberg | 1,875 |
| Ben Pfeiffer | 351 |
| Chris Boggs | 246 |
| cre8pc | 119 |
| digitalpoint | 40 |
| nacho | 34 |
| evilgreenmonkey | 24 |
| seo guy | 22 |
| cshel | 21 |
I then set up an API pull from GA API to pull monthly landing pages and sessions for all users. In addition, we pulled data on pageviews and external links.
After pulling all the data, I noticed that seroundtable.com used AMP, meaning two sets of URLs for many of the articles. Looking at slugs (e.g.,/category/this-is-a-slug.html), thankfully, these were all unique.
I needed to eliminate the categories, author pages, and other pages where the topic was not inferable from the title – limiting to where Screaming Frog found Authors easily cleaned this up.
From there, I cleaned the URL Paths to unique slugs and used that as my match between the crawled URL data and the GA data.
It is worth noting that seroundtable.com data begins in GA in the 4th quarter of 2005. The first post was from the 4th quarter of 2003. As pointed out by Patrick Stox, November 14, 2005, was the official launch of GA, meaning our data encompasses all data through the birth and death of GA as we all knew it.
Before this, the site used Urchin Analytics, which became GA. Of the 27,309 unique slugs found in the crawl, only 0.2% were not found in the GA data. Most were after the data cutoff of June 30, 2023.
Natural language processing (NLP)
After ensuring I had clean page data and Analytics data, I ran the page titles through a process that transitions them to ngrams. An ngram is n-term groupings. For example, “the green frog”, would be comprised of: “the,” “green,” “frog” as 1-grams, and “the green”, “green frog” as 2-grams. Running this over the titles and counting the frequency of each gram level allows for important concepts to bubble up.
We then ran all the important ngrams through a large language model (LLM) to see how well it could pick out important topics and further combine them into relevant categories. This is where we see the limitations of LLMs on niche topics. Although the models helped in the process, there was quite a bit of manually reviewing various ngrams for concepts that could build a category.
Furthermore, there are many entities and concepts like “Google” and “organic search” in the data set that are present in many posts, while temporally important topics like “hummingbird” only last for a few posts and confuse the hell out of language models.
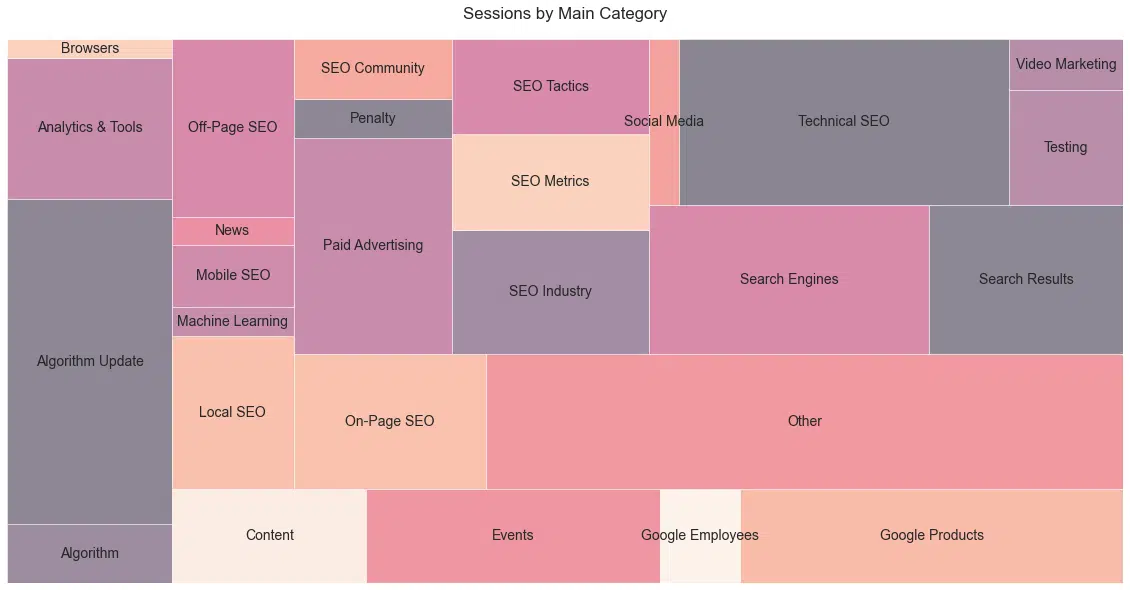
You can review the category data here and review the main category designations in the graph below. We matched the categories to the titles using reverse-word-length-sorted matching to ensure more detailed phrases matched before broader (shorter) phrases. It is worth noting that we broke each topic up into a broad category and a more detailed sub-category.
The graph below (Figure 28) contains the broad categories with sessions above the 25th percentile. Also note that the process of classification is very subjective. To be sure, viewers will find topics they would have categorized differently.
External link data and SEO tool mentions were handled via separate crawls targeting only the portions of each page devoted to the main content.
The SEO tool data differs from the categorized data as it considers the title and content. Categorization of posts was done on the title only.
Table, categorization, and historical (yearly) pageview and session data are available at Tracking 20 Years of Search Data.
Opinions expressed in this article are those of the guest author and not necessarily Search Engine Land. Staff authors are listed here.
Related stories
@media screen and (min-width: 800px) {
#div-gpt-ad-3191538-7 {
display: flex !important;
justify-content: center !important;
align-items: center !important;
min-width:770px;
min-height:260px;
}
}
@media screen and (min-width: 1279px) {
#div-gpt-ad-3191538-7 {
display: flex !important;
justify-content: center !important;
align-items: center !important;
min-width:800px!important;
min-height:440px!important;
}
}
googletag.cmd.push(function() { googletag.display(‘div-gpt-ad-3191538-7’); });
–>
Original Source: Tracking 20 years of search